
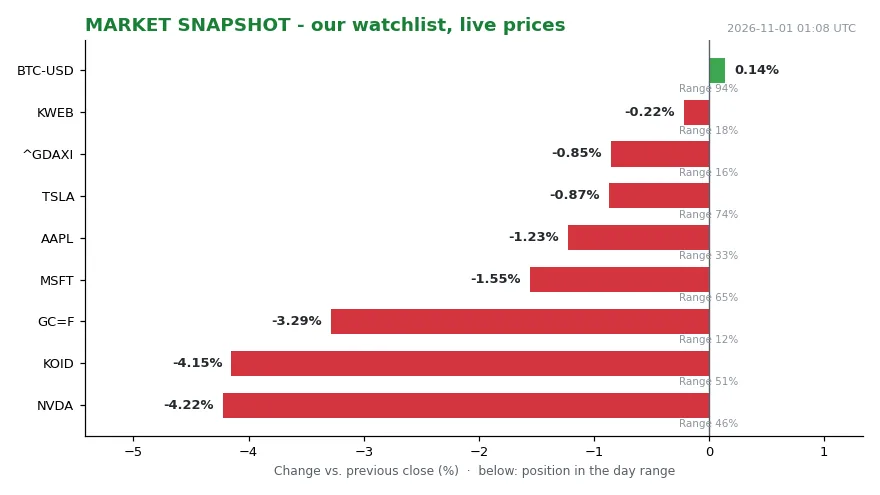
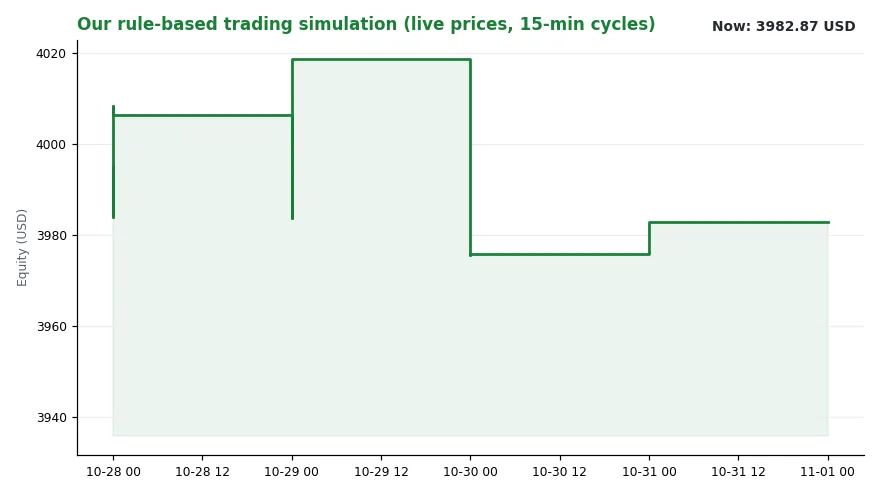
At 01:04 UTC on 2026-11-01 our own watchlist reads like a landscape seen from a plane window: NVDA at 204.64, down 4.22% and sitting at 46% of its daily range; gold (GC=F) at 3,898.90, down 3.29% and pinned near the session low at 12% of range; the DAX at 25,818.21, off 0.85% and at 16% of range; bitcoin at 77,572.55, up 0.17% and near the day high [1]. [1] Our regime reading prints trend=falling with level 3.63, and the busiest signal channel of 2026-10-31 was “central banks” with one event [1]. [1] Sim equity stands at 3,982.87 USD with 2,033.42 in cash [1]. [1] Money is leaving risk assets without visibly arriving in gold. That is the backdrop against which a mid-sized Indiana bank holding company reported its September-quarter numbers — and it is why the composition of those numbers matters more than the headline beat.
What the report actually said
Horizon Bancorp (HBNC) reported revenue of $77.09 million for the quarter ended September 2026, up 24% from the same period a year earlier, with earnings per share of $0.56 against $0.30 in the year-ago quarter [2]. [2] Against the Zacks Consensus Estimate of $76.8 million, that revenue line represents a surprise of +0.38%; the EPS surprise was +5.66% against a consensus of $0.53 [2]. [2] Now the scale, from above: $0.29 million of revenue above consensus, and three cents of earnings per share above it. The preview published ahead of the release had already mapped the expectation — consensus EPS of $0.53, a year-over-year change of +76.7%, and revenue of $76.8 million, up 23.5%. That consensus EPS estimate had been revised 1.56% higher over the prior 30 days, and the Zacks Earnings ESP stood at 0% because the Most Accurate Estimate matched the consensus exactly. The stock carried a Zacks Rank #3 (Hold), and had returned +2.7% over the past month against +1% for the S&P 500 composite [2].
A beat worth four-tenths of a percent
The first belief worth testing is that a positive surprise is information. Here the surprise is arithmetically thin: four-tenths of a percent on the top line and three cents on the bottom line. That is not a verdict on the business. It is a statement about how tightly the covering analysts had bracketed the quarter — and how little room a beat of that size leaves for error in the underlying mix.
When the margin beats but the dollar line misses
This is where the report gets interesting, because the loan book’s core revenue line did not deliver the beat. Net interest income came in at $65.16 million against a three-analyst average estimate of $65.43 million — a shortfall of roughly $0.27 million [2]. [2] Yet the net interest margin printed 4.4% against 4.3% expected [2].
Those two figures sit in tension, and the tension is the story. Margin is a rate; net interest income is a rate times a volume. If the margin beat while the dollar line missed, the arithmetic points to average earning assets running below what the analyst pool had modelled — an inference from the two reported figures, not a line the source states directly.
One mortgage line carried the fee block
The fee lines were, in aggregate, the strong part. Total non-interest income was $11.93 million versus $11.73 million estimated [2]. Service charges on deposit accounts came in at $3.52 million against $3.45 million expected, and the increase in cash value of bank owned life insurance at $0.39 million against $0.38 million [2].
The gain on sale of mortgage loans was $2.13 million against a three-analyst average of $1.37 million — a beat of $0.76 million on a single line [2]. Meanwhile other income landed at $0.6 million against a $1.3 million estimate, mortgage servicing income net of impairment at $0.25 million against $0.38 million, interchange fees at $3.54 million against $3.61 million, and fiduciary activities at $1.47 million against $1.5 million [2].
Mortgage gain-on-sale is a rate-sensitive, transactional line: it is the kind of income that shows up when borrowers move, not the kind that compounds quietly. In this print it alone accounted for more than the entire non-interest income beat.
The cost line that moved the wrong way
It did not show up as an improvement. The efficiency ratio was 53.9% against a three-analyst average of 53% [2]. On this metric a higher number is the weaker outcome, since it expresses non-interest expense as a share of revenue. A bank that beats on earnings per share while its efficiency ratio comes in slightly worse than modelled is telling two stories at once, and only one of them fits on a headline.
Who wins, who loses, who decides
The winners in this print are the revenue lines tied to mortgage activity and deposit service charges. The relative losers are the transactional and servicing lines — other income, mortgage servicing net of impairment, interchange, fiduciary — and, marginally, the cost line. Management decides how much of the mortgage gain can be repeated and how the balance sheet is positioned for margin; the analyst pool, here two to three names per metric, decides what the next consensus looks like. That thin coverage is itself a mechanism: with two or three estimates behind each average, a single analyst revising a model can move the bar that the next quarter is measured against.
What we watch next
First, the net interest income dollar line in the next quarter, and whether the margin stays above 4.3% while volumes close the gap. Second, whether gain on sale of mortgage loans repeats at $2 million-plus or reverts toward the $1.37 million the analysts had modelled. Third, whether the efficiency ratio moves back below 53%. Fourth, the shape of the consensus itself, given that the pre-release estimate had already drifted 1.56% higher over 30 days.
The honest caveat: we cannot distinguish from a single quarter between a one-off mortgage surge and a durable change in origination activity, and our own tape is not offering a friendly backdrop — trend=falling, equities soft, gold near its lows [1]. A Zacks Rank of #3 suggests the stock could perform broadly in line with the market near term, not that it will be re-rated [2].
Sources
[1] Own measurement, market state as of 2026-11-01 01:04 UTC (watchlist quotes, regime reading, sim equity). [2] Zacks Equity Research via Yahoo Finance, “Horizon Bancorp (HBNC) Q3 Earnings: How Key Metrics Compare to Wall Street Estimates,” 2026-10-22. Zacks Investment Research via Yahoo Finance, “Horizon Bancorp (HBNC) Reports Next Week: Wall Street Expects Earnings Growth” (preview: consensus, revisions, Earnings ESP, Rank).
Educational analysis only. No investment recommendation or solicitation. Figures as reported by the cited sources; forward-looking items are uncertain.
—