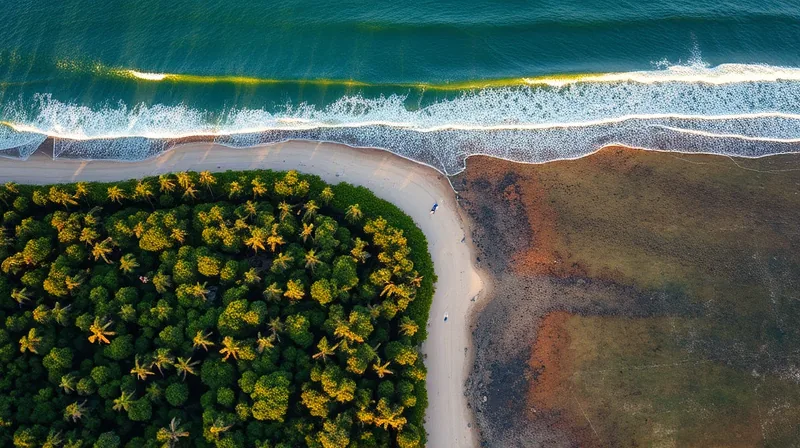
Reading the Coast from Orbit
Mangrove forests look, from a satellite, like dark green stitches sewn along the seams of tropical coastlines. Those stitches hold. For decades, the question of why a mangrove grows in one place and not another has been answered with temperature, salinity, sediment, and tides. Waves rarely entered the conversation. A new global analysis puts them at the center.
The study treats mangrove presence as a yes-or-no outcome and asks what flips the switch. Its authors built a process-driven model — meaning the model encodes physical steps rather than merely correlating variables — and fed it twenty years of open-source hindcast wave data. At four hundred coastal sites scattered across the planet, the model examined three separate swell partitions. [1] The implications reach beyond the present map: if waves decide where mangroves can stand, then a shifting wave climate redraws the coastline itself.
Three Institutions, One Question
The model’s architecture reflects that care.
A Library of Forests, a Library of Numbers
A separate effort synthesized three global databases to produce annual mangrove forest area from 2000 through 2012 at high spatial and temporal resolution. That work extracted mangrove cover by combining the Global Forest Change database, the Terrestrial Ecosystems of the World database, and the Mangrove Forests of the World database.
Indonesia remains by far the largest mangrove-holding nation, containing between 26 percent and 29 percent of the global inventory, with a deforestation rate between 0.26 percent and 0.66 percent annually. [1] Countries showing relatively high amounts of mangrove loss include Myanmar, Malaysia, Cambodia, Indonesia, and Guatemala. Southeast Asia is a region of concern, with deforestation rates between 3.58 percent and 8.08 percent during the analysis period — in a region that holds half of the entire global mangrove forest inventory. Global mangrove deforestation continued but at a much reduced rate of between 0.16 percent and 0.39 percent annually, a pattern of decreasing rates with many nations essentially stable, the largest mangrove-holding region excepted. [1] One dataset tells you where mangroves are and how fast they are disappearing. The other tells you why they are there at all. A standardized global spatial dataset that monitors deforestation at high resolution can feed the same kind of mechanistic model that the wave analysis built — and the wave analysis, in turn, gives restoration planners a way to read a coastline before committing a seedling to it. The two efforts do not cite each other as rivals. They are complementary instruments, and the fact that both chose the global scale, both chose open data, and both chose to make their products usable by others suggests a field that has learned to build infrastructure rather than one-off studies.
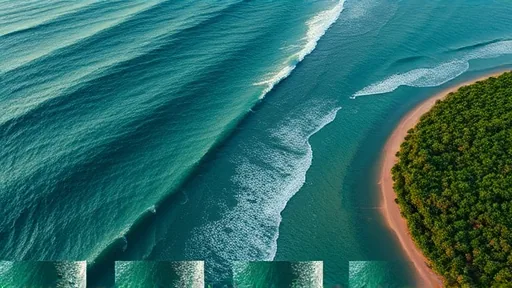
The parallel is not accidental. When a discipline can map a forest from orbit and model the waves that decide whether the forest can exist, it has moved from describing nature to predicting it. That shift is what makes the 78.2 percent accuracy figure more than a statistic. It is a claim that the coast is legible — that the same physical reasoning applies in the Bay of Bengal and the Gulf of Mexico, and that a changing wave climate will rewrite the map in ways we can now anticipate rather than merely observe.