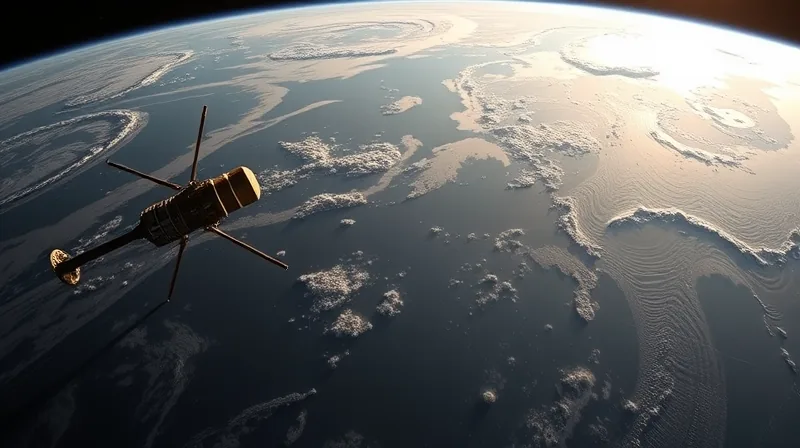
Satellites See an Ocean Tilted Like a Tub
From orbit, the Pacific does not look tilted. Satellites that measure ocean height see it differently. They detect a slow, enormous transfer of warm water from the western side of the basin toward the east, and the sea surface itself rising as that water arrives. What it reports in 2026 is a basin leaning eastward — and a coastline about to feel it.
The numbers are not subtle. The eastern Pacific currently sits roughly 40 centimetres above its normal level, according to Paul Roundy at the University at Albany in New York state. [1] Roundy expects a strong westerly wind event to push those levels higher still over the coming weeks.
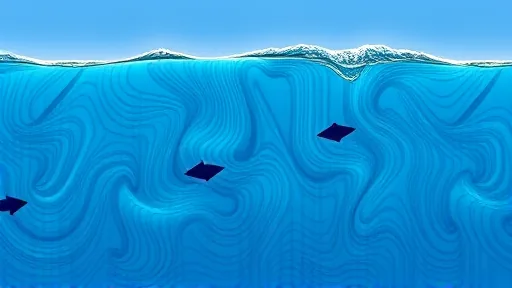
The mechanism behind the tilt is a see-saw. Warm water sloshes eastward across the equatorial Pacific, driven by bursts of wind that blow against the usual trade winds. Thomas Monahan at the University of Oxford describes the resulting Kelvin waves in a way that strips away the jargon: “A Kelvin wave is more similar to raising the water level in a bathtub.” [1] It is not a wave you could surf. It is a swell in the water’s height, crossing the Pacific in about 60 days, then turning to run along the coasts. Monahan expects the peak to arrive with the highest sea surface temperatures, projected for late November or December.
The physics here stops being linear, and that is the part that matters most. A study by Monahan and colleagues found that sea-level change is amplified by strong El Niño events rather than scaling in proportion to their strength. [1] “So, if you were to just extrapolate from smaller events, you would miss what is happening in the stronger events,” he says.
The Same Physics, Scaled to a Coastline
The basin-wide tilt is the large system. The coastline is the small one, and the same principle applies there with different arithmetic. Monahan’s team, analysing past events, calculates that sea level could rise between 24 and 40 centimetres in the Galapagos islands, depending on how strong this El Niño becomes. On the mainland the effect is smaller: Peru and Ecuador could see rises of between 19 and 33 centimetres. Farther from the equator, in California, the estimate drops to between 9 and 13 centimetres.
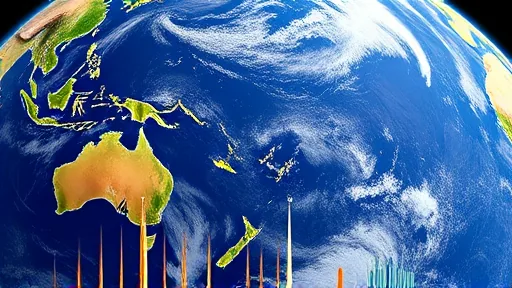
Those figures sit on top of a longer, slower rise. Global mean sea level has risen about 20 centimetres since 1900 because of global warming. The consequence is a comparison that reads like trivia and is not: even if this El Niño proves weaker than the catastrophic event of 1877/78, the sea-level rise it produces will still be bigger than that event delivered.
California adds its own multipliers, and their timing is unfortunate. One is astronomical. The moon’s orbit is inclined relative to Earth’s equator, producing an 18.6-year lunar nodal cycle, and the moon’s elliptical orbit rotates on an 8.85-year perigean cycle. The highest tides from these cycles coincide with this El Niño, effectively adding around 5 centimetres along the California coast on top of the El Niño effect. Monahan notes the timing is unhelpful: “Rather problematically, the biggest peaks in the tides are expected to occur during Thanksgiving week and Christmas week, among the highest in terms of travel and people being around.” The second multiplier is atmospheric. El Niños deepen a low-pressure area near the Aleutian islands off Alaska, which increases storm activity, and bigger storms drive bigger surges. The third is wave energy. During the 2015/16 El Niño, waves over 15 metres hit Oregon — the largest ever recorded there. Put the three together — extra-high tides, larger surges, bigger waves — and you have a coastline where several independent effects can arrive at the same hour. Daniel Swain at the California Institute for Water Resources puts the stakes plainly: “We may see coastal flooding and erosion in some areas that rivals or exceeds historical records — perhaps by a significant margin.”
The Measurement Still Missing
Monahan’s team built its range of 24 to 40 centimetres in the Galapagos from analysis of past El Niños and how sea level responded. That method depends on the record being long enough and on the satellites staying alive to extend it.
That last condition is not guaranteed. A 2025 assessment of Earth’s energy imbalance — the gap between sunlight arriving and heat leaving — found the imbalance has doubled in recent years, an anomaly its authors described as having “clearly caught us off guard.” The same assessment also raises concerns about the future of the observations on which that finding rests, at a time when the satellites that underpin them have finite service lives. The instruments that measure ocean height and the planet’s heat budget are not permanent fixtures. They are hardware with service lives, and the record they produce has seams.
This is why the next step is not a better model but a better measurement: the satellites must still be there when the water arrives.
Researchers have also raised the possibility that the projected 2026-2027 El Niño could coincide with local maxima of long-period astronomical tidal cycles, a combination they suggest might drive some high waters toward extreme percentiles at certain sites, with potential flooding and ecological impacts. The same work points to a substantial background shift accompanying these events, on a scale that researchers have linked to decades of projected sea-level rise under a moderate emissions pathway. Fifty years of slow change, delivered in a single season. The tide tables will show the hours. Only the altimeters will show whether the water arrives at the height the hindcasts predicted — and whether the record survives long enough to say so.