
Almost Half SP 500 Stocks Move Against The Index
Meta commentary - no external expert source; basis: Cnbc (2026-09-29). #MetaEconPol
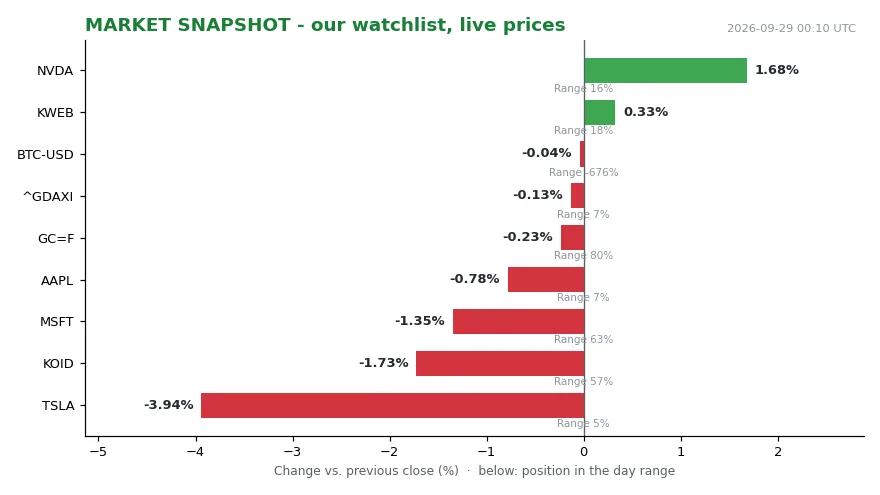
Our own tape, pulled one minute before the 00:05 UTC snapshot on 2026-09-29, tells a story the headline index does not. NVDA printed 228.86, up 1.68 % on the day, yet it sat near the bottom of its range — 16 % of it. TSLA printed 357.45, down 3.94 %, and even deeper in the basement at 5 % of range. AAPL printed 338.40, down 0.78 %, and finished near its low, 7 % of range. MSFT slipped 1.35 % and closed mid-range at 63 %. The index proxies barely moved: ^GDAXI at 25374.42, down 0.13 %, also leaning toward its low at 7 % of range. KWEB gained 0.33 % at 24.66, near its low too, 18 %. Gold traded 4157.00, down 0.27 %, mid-range at 68 %. Bitcoin sat at 83487.03, down 1.15 %, mid-range at 40 %.
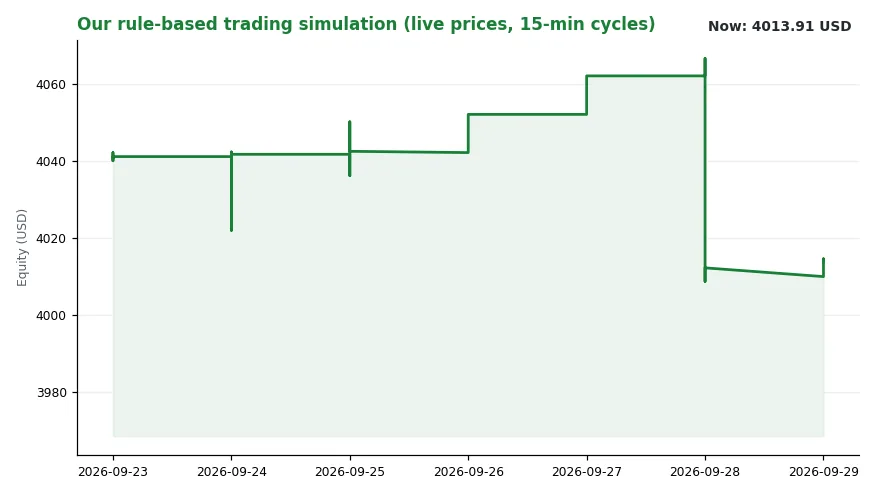
Our rule-based book closed at 4014.31 USD, up 0.05 % against the same time yesterday, holding 1210.27 in cash. The regime reading: trend=falling, level=3.63. The latest logged decision: WATCH KWEB at 0.00, timestamped 2026-09-29 01:53:43. KOID printed 35.88, down 1.73 %, mid-range at 57 %.
Single names moved 3, 4, even nearly 6 percentage points apart from each other. The aggregate moved almost not at all. That is dispersion, not direction — a market in which the members have stopped marching to the same drum.
The sell-side has put a number on the same phenomenon. About 45 % of S&P 500 stocks carried a negative three-month beta, according to a recent Goldman Sachs note. [1] Beta is a measure of how a stock moves relative to the market. A negative beta means the stock’s returns moved in the opposite direction of the S&P 500 over the window in question. Nearly half the index, in other words, has been rowing against the boat.
The divergence shows up in breadth statistics as well. The S&P rallied 1.5 % last Monday. On that same day, 30 members touched a 52-week low while only 7 scored a new high. Jason Goepfert, founder of SentimenTrader, notes the last time the index gained at least 1 % while within 1 % of a new 52-week high, with new lows outnumbering new highs, was December 1999 — just before the dot-com top. [1] Both readings point the same way: an index can sit at or near records while its components pull in opposite directions.
Why the gap opens
The gap mostly reflects concentration, according to Adam Turnquist, chief technical strategist at LPL Financial. Mega-cap technology companies carry an outsized weight in the benchmark. A strong run in a handful of them can lift the index even while many other members fall. “It only takes a few of those mega caps names to work, and a lot of the smaller weighted stocks don’t need to work,” Turnquist told CNBC. [1] He points to unusually low correlations among S&P 500 stocks.
Bradley Krom, director of investing strategy at WisdomTree, explains why the index can look calm while individual stocks make large moves. “Beta is a function of correlation and volatility,” Krom said. When stocks move big at different times and for different reasons, those moves largely cancel out at the index level. The arithmetic of a cap-weighted index does the rest: the largest members dominate, the smallest barely register.
AllianceBernstein used one-year trailing returns and found an unprecedented share of U.S. stocks displaying negative beta, as AI winners powered the gains. Semiconductor makers, hardware companies and other AI infrastructure beneficiaries have ridden enormous capital spending. Companies outside that trade have struggled to keep pace. Kurt Feuerman, chief investment officer of Select U.S. Equity Portfolios at AllianceBernstein, put the cost plainly. A narrow market “can also distort the signal investors receive from index returns,” he wrote. When a handful of companies dominate performance, many financially sound businesses may lag or decline simply because they are not tied to the most powerful market narrative.
Energy tells a separate story. “Another part of the other story is energy,” Turnquist said. “That’s been pronounced this year: higher oil prices, higher energy stocks and then the rest of the market trades lower.” Earlier this month, Evercore ISI used a six-month measure to flag 115 S&P 500 stocks with negative beta. The list skewed toward energy, utilities and consumer staples. The investment bank called energy a “synthetic S&P 500 put option” because of how the sector has reacted to geopolitical pressure.
Who gains, who pays, who decides
The winners are the index heavyweights and every fund whose mandate is to track the benchmark. The AI complex — chips, hardware, infrastructure — has been the clearest beneficiary of concentrated capital spending. Energy and defensive sectors have become something else: hedges that pay when the rest of the tape falls.
The losers are less visible because they never reach the headline. A financially sound company without a link to the dominant narrative can lag for quarters with nothing wrong in its business. Anyone who owns the index owns the concentration too, whether or not they chose it.
The decisive actors here are not central banks. They are index constructors and the market itself, acting through market capitalisation. Weight is allocated by size, and size now clusters in a few names. Our own signal layer logged its busiest channel on 2026-09-27 as “central banks,” with two events. Macro still moves the tape. But this particular divergence is manufactured by index mathematics and by the concentration of capital, not by a rate decision.
What we watch, and what we do not know
Turnquist thinks the number of negative-beta stocks could fall if leadership broadens. Even then, he expects dispersion to stay elevated as investors remain selective about AI beneficiaries. Krom expects the extremes to revert to the mean eventually. He notes similar spikes appeared around the 1999-2000 dot-com bubble, when concentration and large moves in a narrow group triggered unusual divergences.
Neither of them accepts the dot-com comparison as a forecast. Turnquist argues today’s leading tech companies are more mature, with established revenue and products. Krom agrees. The pieces driving returns, he says, do not share the historical relationships they once had. “It is not the same market environment now versus 2000,” he said. The negative betas boil “down to the amount of market concentration.”
What we cannot say is which way this resolves. Breadth may improve, or concentration may deepen. Goldman’s three-month figure is built from a window that drops one day and takes on another every session. The 45 % reading is therefore a snapshot, not a verdict. The same is true of the 40 % that CNBC calculated and the 17 % one-year share.
The next window closes on a fixed date. Our data is stamped 2026-09-29, and the quarter ends on 30 September 2026. That is when the trailing three-month measures roll onto a new quarter of returns, and the next breadth numbers will either confirm the divergence or quietly dissolve it. Until then, we watch two things: whether the index can keep rising while its members fall, and whether the dispersion in our own tape narrows back toward the mean.
Sources
1. MSN (Original laut Text: CNBC) — Portal copy
Mentioned organisations (context, not sources)
- Goldman Sachs — Organisation (homepage)
- SentimenTrader — Organisation (homepage)
- LPL Financial — Organisation (homepage)
- CNBC — Organisation (homepage)