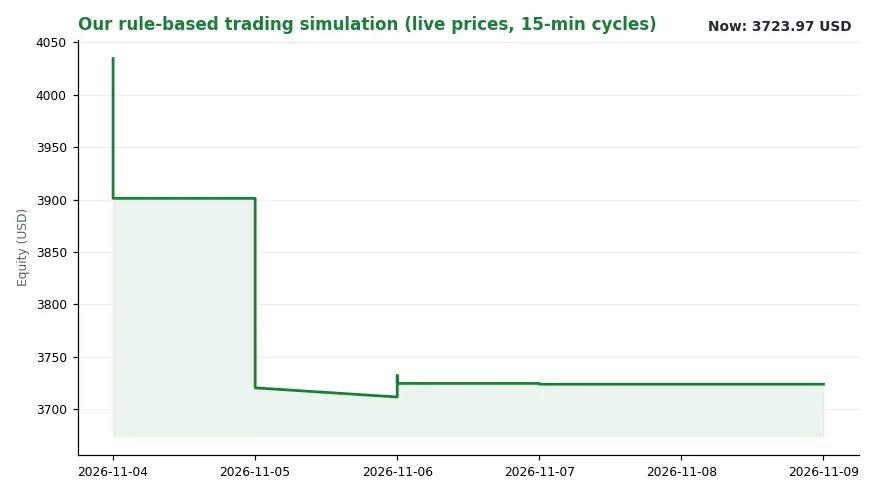
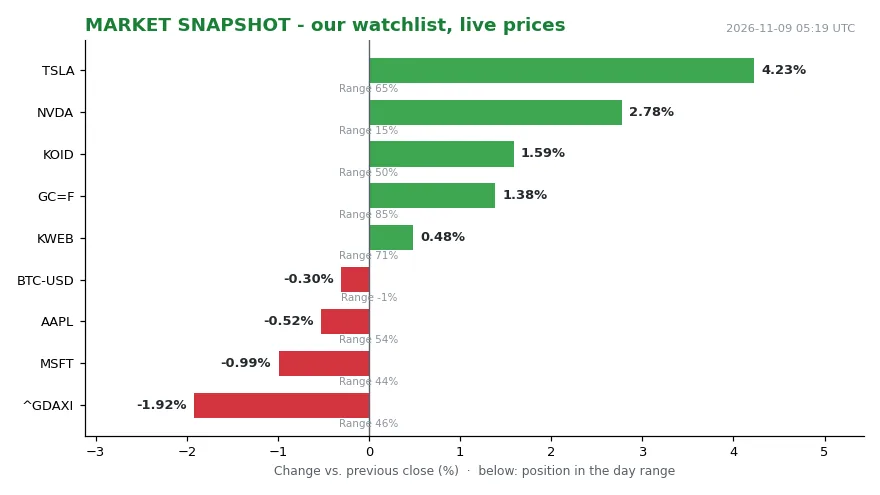
Our tape for Nov. 9, 2026, opens on a split screen. Nvidia printed 186.64, up 2.78% from the previous close, but it sat near the day’s lows — only 15% of its intraday range, meaning the early bid did not hold. Gold at 4,132.30 was 1.41% higher and parked near its highs, 86% of the way through its range. Germany’s DAX was 1.92% lower and mid-range at 46%, bitcoin slipped 0.21% and hugged the bottom of its range at 6%, while Tesla (+4.23%, 65% of range), Apple (-0.52%), Microsoft (-0.99%), KOID (+1.59%) and KWEB (+0.48%, 71% of range) filled in a mixed middle. Reading across our nine names, the pattern is rotation rather than retreat: the marginal bid went to the hard asset and to a couple of momentum names, while follow-through in the largest technology position faded at the first sign of supply. Our regime reading — trend falling, level 3.63 — and a signal layer whose busiest channel today is “central banks” with two events point the same way: policy, not earnings, is setting the tone. Our simulated book sits at 3,723.97 USD, unchanged versus the same time yesterday, with 1,863.17 in cash and a WATCH decision on KWEB.
That frame fits the news of the past three weeks unusually well.
The controversy: expectations stopped falling
The University of Michigan’s Oct. 23 report, “Risks of Entrenchment: Long-Run Inflation Expectations in Recent and Longer Historical Context,” makes an argument that is narrower and more uncomfortable than another bad inflation print. [1] It is not that prices rose; it is that Americans have stopped assuming they will stop rising.
The October Surveys of Consumers put expected inflation over the next 12 months at 4.7% and over the next five to ten years at 3.5%. The long-run figure climbed from 3.4% in September and remains above its 2024 range of 2.8% to 3.2%. September annual CPI inflation ran 3.7% (Bureau of Labor Statistics), against a Federal Reserve target of 2.0%. That is five consecutive years above target, and everyday prices roughly 30% above pre-pandemic levels, according to the University of Michigan report.
The controversy is whether 3.5% is a warning or a shrug. Michigan’s answer is that expectations, once they drift, start doing work of their own.
The mechanism: the ratchet, not the spike
The channel is behavior, not sentiment. When households believe something will cost more next year, they may buy it today. Businesses facing rising input costs may raise prices sooner. Workers seek larger raises to protect purchasing power. Each response validates the expectation that produced it — a self-reinforcing loop that is harder to extinguish than the original shock.
The Michigan researchers found this exact shape in the inflationary episodes from the late 1960s through the 1980s: expectations surged during successive shocks, then retreated, but every recovery left them higher than before. [1] The next episode therefore began from a higher starting point and peaked higher. Rising prices became something Americans expected rather than an occasional disruption.
Today is not a rerun. The researchers place the post-pandemic episode near the beginning of that pattern, not in the worst years of the 1970s. But two subsequent inflationary policy shocks have complicated the recovery, and consumers may now be reading price increases as continuing rather than temporary. Upstream data supports the worry: September’s Producer Price Index rose 6.3% annually, and diesel producer prices surged 115.2% (BLS).
This is also where the Federal Reserve’s problem sits. Holding rates elevated restrains demand but raises financing costs for businesses, homebuyers and consumers. Cutting prematurely risks validating the very expectations policymakers are trying to contain.
The arithmetic: what another round costs a family already stretched
The Cleveland Fed’s Nov. 2 inflation nowcast projects headline CPI at 4.25% year over year in November, up from a projected 3.74% in October, with headline PCE at 4.03% and core PCE at 3.31% (from 3.20%). [1] Those are preliminary model estimates, not official readings, and they are revised as data arrive.
The level matters more than the rate. A family spending $60,000 in 2019 now needs roughly $78,000 for the same basket. Another 4.25% takes that to $81,315 — an additional $3,315 a year, or $276 a month, stacked on the $18,000 already accumulated. Employer-sponsored family health coverage averages $28,303 annually, with workers at smaller companies contributing $2,847 more than those at large employers.
September’s CPI detail shows where the pressure originates: prices rose 0.6% month over month, the largest increase in five months, with gasoline up 9.1% for the month — more than half the total — and 34.2% over the year, energy up 20.4% annually, fuel oil up 74.2% on the year, airfares up 22.4% over the year. Core inflation was milder at 2.6% year over year, though “supercore” services ran at roughly a 4.6% annualized pace over three months. Real average hourly earnings fell 0.7% year over year in August, the sixth straight month of year-over-year declines.
Who wins, who pays, who decides
Persistent above-target inflation redistributes rather than destroys. Companies with strong cash flow, manageable debt and the ability to pass costs along without losing customers are the structurally advantaged group; growth businesses whose profits sit years in the future are more exposed when rates stay elevated, and valuation becomes a heavier variable. Nearly $8 trillion in money-market funds is the reminder that expensive equities have competition. That is a description of the mechanism, not a recommendation.
On the losing side sit leveraged balance sheets, rate-sensitive borrowers, and households whose wage growth is not keeping pace — real earnings have now gone six months without a year-over-year gain. The decision-maker is the Federal Reserve, with energy supply and trade policy as the variables it does not control.
What we watch next
Four things, honestly uncertain. First, whether the long-run Michigan reading holds above its 2024 band or climbs again from 3.5%. Second, whether the Cleveland Fed nowcast is revised down as official data land — it is a projection, and projections move. Third, whether September’s producer price pressure shows up in core PCE, which is the pass-through test. Fourth, our own tape: whether gold keeps closing near its highs, whether the fading follow-through in Nvidia persists, and whether the central-bank channel stays the busiest signal we carry.
The view from the other side
The counterargument is not naive. Core prices rose 2.6% over the year through September. And the entrenchment thesis itself places today at the start of a historical pattern rather than inside its worst chapter. The plainest fact in the data is that the price level does not come back down; it only stops rising as fast. Whether that starting point hardens into the new normal is a question the next few Michigan readings, and the core PCE pass-through, will answer before any survey can.