
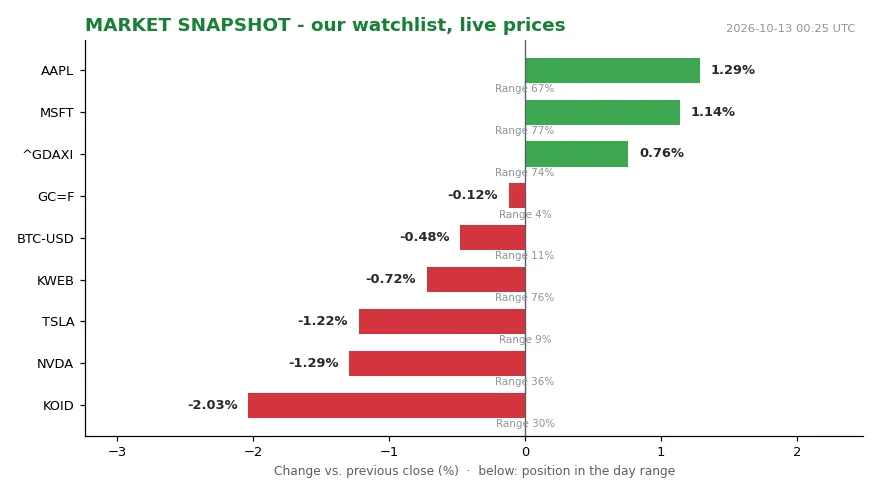
Monday’s close left Nvidia at 226.32, down 1.29% and parked at 36% of its daily range. Microsoft finished at 541.15, up 1.14%, near the top of its range at 77%. Tesla ended at 378.03, down 1.22%, pinned at 9% of its range — near the floor of the session. Apple printed 340.97, up 1.29%, mid-range at 67%. Four of the largest technology names, two different directions, one trading day.
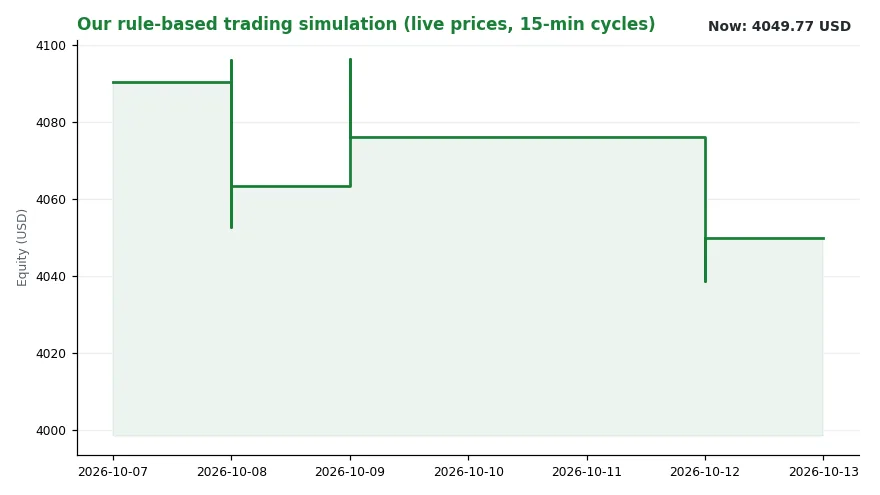
That split is the pattern our own data keeps sketching. Bitcoin traded at 81,376.14, down 0.46% and near its day lows. Gold futures sat at 4,189.00, essentially flat and near the bottom of their range. The DAX gained 0.76% to 25,277.68. KWEB slipped 0.72% to 24.75, yet still finished near the top of its range at 76%. KOID dropped 2.03% to 34.68. Our regime reading stands at trend=falling, level 3.63. The busiest channel on our signal layer during October 12 was “central banks,” with two logged events. Our rule-based sim book held 4,049.77 dollars, unchanged against the same hour a day earlier, with 2,049.10 dollars in cash. Its most recent logged decision was WATCH KWEB.
What those readings describe is dispersion, not a single tide. The mega-cap complex that carried the index for four years no longer moves as one unit. Crypto and gold sat near their lows while a European index and a China internet proxy held mid-to-upper range. Nothing in that picture says “risk on” or “risk off.” It says the market is choosing selectively, and the selection is narrower than the index headline implies.
That is the backdrop for this week’s milestone. Monday marked the fourth anniversary of the current bull market. [1] The S&P 500 has climbed nearly 120% since its closing low on Oct. 12, 2022. [1]
Where Four Years Came From
The run has a starting date and a spark. Since the release of ChatGPT in late 2022, investors have hungered for everything related to the AI trade, and the stocks most tied to the build-out — the so-called “picks and shovels” — flew to whole new stratospheres. Nvidia, formerly best known for the graphics cards it built for high-end video games, passed the 1 trillion dollar market cap for the first time in 2023 and is now a roughly 5.5 trillion dollar company. Micron Technology, another beneficiary, passed the 1 trillion dollar market cap for the first time this May. Two suppliers, two trillion-dollar thresholds, one underlying spending cycle.
Where the Compute Bill Lands
A new model class arrives, and enterprises decide to buy compute. Buyers of compute order chips, memory and networking gear. Suppliers book revenue, and earnings follow revenue. Multiple expansion follows earnings. A market-value-weighted index then hands more influence to whichever companies grew fastest. With tech carrying heavy weight in the S&P 500, the benchmark’s fate is tightly bound to a single capital-spending theme.
The rates channel cuts from the other side. Investors face ongoing fears around higher inflation, surging bond yields and a more hawkish Federal Reserve. Higher yields raise the discount rate applied to future earnings. That is precisely what long-duration growth stocks sell. Higher yields also raise the financing cost of the build-out itself. So the same technology cycle that drove the last four years is now partly hostage to the bond market.
And breadth has already thinned. In September, 75% of stocks in the S&P 500 closed in negative territory, as the threat of higher interest rates spurred investors back into a few mega-cap companies. Small caps, especially, have suffered.
Who Wins, Who Waits, Who Decides
Not everyone reads the trade the same way.
So the ledger splits. Four years of gains have concentrated in the compute suppliers and in the cap-weighted index funds that hold them at rising weights. The pressure has landed on small caps and on the median constituent, as the September showing demonstrates. The decision-makers are few and identifiable: the Federal Reserve on rates, corporate boards on capital spending, and the index rules that concentrate the benchmark in one sector.
What to Watch Next
Earnings are the nearest test. While the third-quarter reporting season is expected to be strong, some worry that results may not be strong enough to lift share prices given how high expectations have grown.
Breadth is the second test. A rally that keeps making highs on fewer participants is a narrower rally, not necessarily a finished one. Wald’s reading of the data is that the median time remaining before a cycle reached its peak was 13 months, which suggests 2027 could be the final leg of the run — though he added that the median fifth-year return was still 21%.
Rates are the third. Our own regime reading — trend=falling, level 3.63 — is an observation, not a forecast, and we treat it that way. The same goes for our sim book: flat on the day, half in cash, with a logged WATCH on KWEB. That is a record of what our rules did, not a claim about what comes next.
Wald’s 13 months is a median across past cycles, not a countdown clock. Breadth can repair itself, or it can deteriorate further, and the data will tell us which is happening only after the fact.
The practical takeaway is arithmetic, not prediction. If roughly 40% of the S&P 500 now sits in tech, then a passive holder owns a concentrated bet that was never explicitly chosen. Four years of a 120% run have been generous, and the same handful of names our ticker list shows drifting apart now carry a larger share of the benchmark than they did at the start.