Our tape first
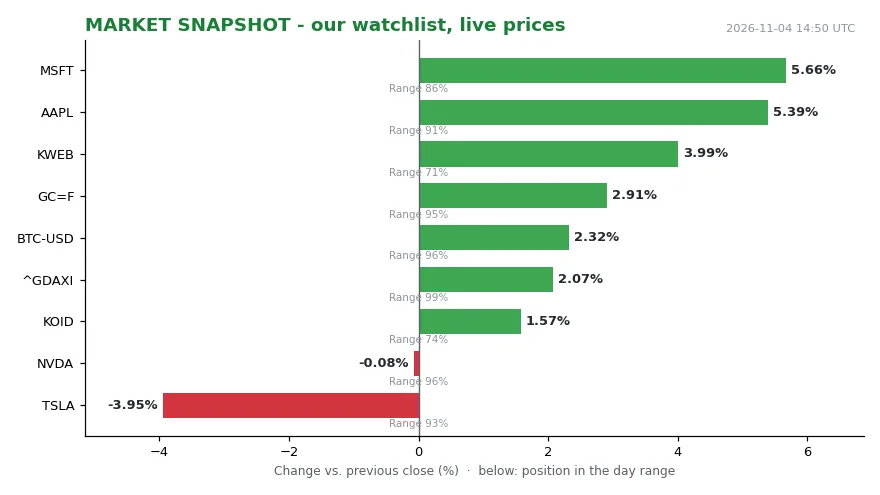
At 14:46 UTC on 2026-11-04 our watchlist sat pinned to the top of its daily range: NVDA at 206.32 (-0.18%, yet at 100% of the day’s range), AAPL at 349.25 (+5.23%, 95% of range) and MSFT at 549.25 (+5.42%, mid-range at 73%). The same shape showed up outside single stocks — gold at 4,052.20 (+2.84%, 93% of range), BTC-USD at 79,347.59 (+2.60%, 102% of range), the DAX at 26,387.51 (+2.02%, 96% of range), KWEB at 24.26 (+4.16%, 93% of range) and KOID at 34.25 (+1.72%, 100% of range).
Read as a pattern, that is breadth with a seam running through it. Seven of nine watched instruments finished the window in the top decile of their range, and the dispersion sat inside technology rather than between technology and everything else: two mega-caps up more than 5%, TSLA down 4.14% and still near its own high at 86% of range. That is rotation within the AI complex, not an exit from it — with gold and bitcoin bid at the same time, which our data reads as hedging running alongside exposure rather than a single directional bet.
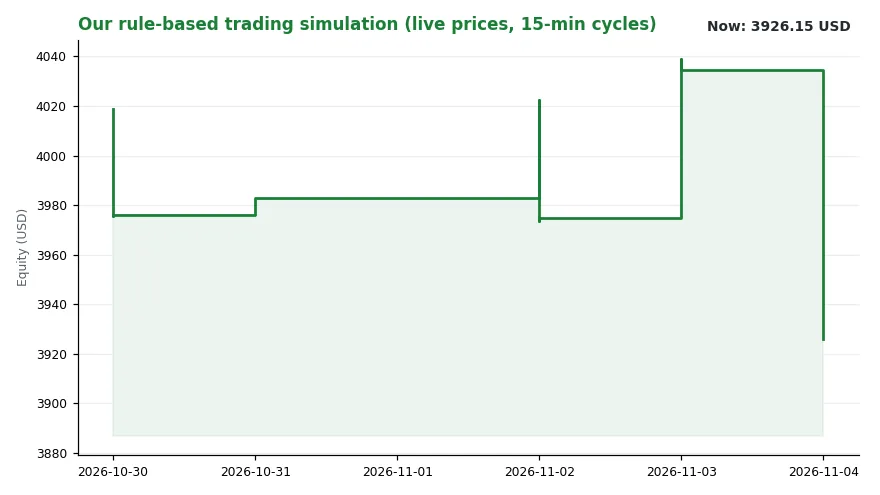
Two counterweights belong in the same breath, because we document rather than tidy. Our rule-based sim equity stood at 3,926.15 USD, down 2.68% against the same time yesterday, with 3,925.38 USD of that in cash — effectively no exposure. The regime reading was trend=falling, level=3.63. Our last logged decision was a SELL of TSLA at 377.10 at 15:35:18, below the 382.00 it prints now, and the busiest signal channel of the day was “other” with 8 events.
The landscape the record describes
That split tape is the backdrop for a question the historical data answers with unusual consistency. CNBC’s analysis of S&P 500 returns after elections from 1980 through 2024 puts the immediate reaction at an average gain of 0.2 % after one day and 1.1 % after one month, combining presidential and midterm contests. [1] One year later the numbers sharpen: 13.7% average after midterms, 13.8% after presidential elections, positive in 91% of cases, and up after all 11 midterms from 1982 through 2022. [1] The result does not depend on the outcome — red wave, blue wave, split decision or status quo, in CNBC’s framing.
Extend the window and the magnitude grows. Nineteen calendar years followed midterm elections between 1950 and 2022, and the S&P 500 gained in all 19 on a total-return basis, averaging 20.9%, according to Morningstar and PNC Financial Services data compiled in a 247wallst analysis. The individual years are uneven, measured as calendar-year total returns from January through December following each midterm rather than the twelve months after Election Day: 2003 +28.7%, 2007 +5.5%, 2011 +2.1%, 2015 +1.4%, 2019 +31.5%, 2023 +26.3%.
Nineteen is a small number, and a streak that includes a +1.4% year is a record of direction, not of magnitude.
What the market actually prefers
The preference visible in the data is structural rather than partisan. Across 10 midterm and five presidential elections that left no single party in charge, the S&P 500 rose an average 15% one year later, positive in 14 of 15 cases. After elections producing single-party control, the average one-year gain was 11.5%.
Ryan Detrick, CNBC contributor and chief market strategist at Carson Group, described the mechanism behind that wave aversion: “If you have a huge red wave or a big blue wave, markets actually kind of don’t like that as much because you have too much spending one way and too much power.” [1] The most specific configuration in the source is also the one flagged as possible this cycle: Democrats holding both houses of Congress with a Republican in the White House. Across the three midterms that produced it — 1986, 1990 and 2006 — the S&P 500 averaged a 0.5% decline on the reaction day, then rose 3.4% a month later and 10.9% after a year, per CNBC’s analysis.
Party labels at the top matter even less. Median calendar-year returns after midterms since 1950 were 25.6% under Republican presidents and 22.8% under Democratic ones, both far above the roughly 10% long-term average annual gain including dividends — a median of calendar years, not a one-year average.
The channel: uncertainty, not outcome
The transmission line is policy uncertainty, not the identity of the winner. Elections bundle open questions on taxes, regulation and government spending; once votes are cast, part of that bundle is resolved and investors can price a narrower set of paths. J.P. Morgan Asset Management makes this argument in the 247wallst piece: what changes is clarity about which policies might emerge, not the underlying profitability of companies — corporate profits, economic growth and Federal Reserve policy still set the price.
Detrick frames the same channel as a relief trade around the event: “There’s some anxiousness before these elections. Once you are through it, it’s a big relief and markets tend to do pretty well.” [1].” The record itself, however, warns against reading the calendar as a cause. Elections may be coincident events to factors that matter far more. The S&P 500 fell 22.1% in the year after the 2000 elections as the dotcom bust unfolded — the worst post-election performance since 1980 — while the best was a 38.3% gain in the year after 2020, when markets rebounded from the COVID selloff. In 2018, Democrats took the House and the index ended the year down 6.2%; the more relevant fact was the Fed raising rates four times. Even then, the market was up 11.7% a year after that vote.
Who decides
Federal Reserve policy and the corporate earnings cycle ultimately matter more than elections, according to Société Générale. That ranks the actors. The Fed sets the discount rate; earnings set the cash flows; the bond market sets the cost of carry and, with yields rising globally and a mini debt crisis in France, is currently doing much of the talking. Politics draws the policy envelope around all three.
Within equities, the AI infrastructure buildout is the variable with a political edge: a Democratic sweep of the House and Senate would almost certainly pressure it, per CNBC, and could lead to more retrenchment. On the other side of the ledger sit the hedges our own tape showed being bought alongside the equity bid — gold and bitcoin both near the top of their ranges.
The variables that outrank the calendar
The AI capex cycle comes first: Detrick’s condition is that as long as the AI wave is still moving and the economy keeps growing, “this bull market is probably still alive and well”. Valuation and rates come next — a Shiller CAPE above 40 has historically been associated with weaker long-term returns, and a 10-year Treasury yield above 5% offers investors an alternative to stocks. Geopolitics follows: the war with Iran could worsen post-election, and France’s debt situation is unresolved. And our own regime reading of trend=falling sits underneath all of it.
The caution
Jim Reid, Deutsche Bank’s global head of macro and thematic research, drew the boundary in one line: “Seasonality isn’t destiny, and worries around Iran, AI and France won’t mysteriously vanish.” [1].” Anyone treating the post-midterm record as a position rather than as a base rate is leaning on exactly the part of the map that history has been least able to fill in.
Sources
Mentioned organisations (context, not sources)
- CNBC — Organisation (homepage)
- Morningstar — Organisation (homepage)
- /7 Wall St. — Organisation (homepage)
- Congress — Organisation (homepage)
- J.P. Morgan Asset Management — Organisation (homepage)
- Société Générale — Organisation (homepage)
- House of Representatives — Organisation (homepage)
- Senate — Organisation (homepage)
- Deutsche Bank — Organisation (homepage)
- Democratic Party — Organisation (homepage)