
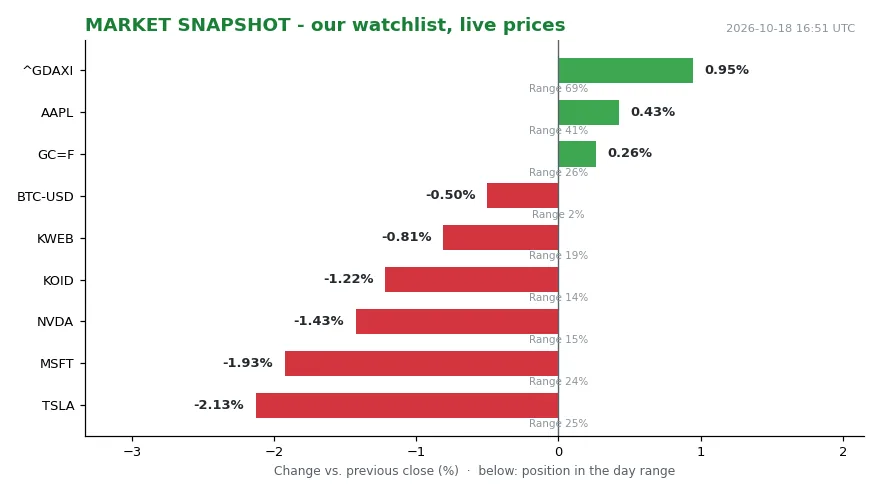
Seven of the nine instruments on our watchlist closed the 2026-10-18 session in the bottom third of their daily range. NVDA printed 214.13, down 1.43 per cent against the previous close and sitting at 15 per cent of its range. MSFT printed 529.05, down 1.93 per cent, at 24 per cent of range. BTC-USD printed 80,975.00, down 0.50 per cent, at 2 per cent of range — pinned to the floor. TSLA at 354.72 (-2.13 per cent, 25 per cent of range), KWEB at 24.41 (-0.81 per cent, 19 per cent) and KOID at 32.47 (-1.22 per cent, 14 per cent) leaned the same way. Three names were up. AAPL at 343.46 was up 0.43 per cent and mid-range at 41 per cent. GC=F gold at 4,181.10 was up 0.26 per cent at 26 per cent. ^GDAXI at 25,622.61, up 0.95 per cent, sat at 69 per cent of range — the strongest green in the book. All quotes were fetched two minutes before writing.
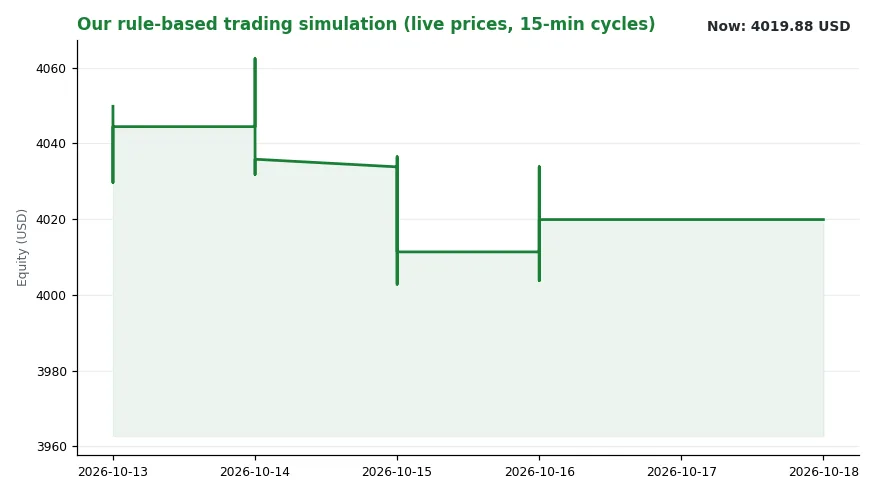
That is a rotation pattern, not a stampede: risk is being trimmed at the edges, with crypto held closest to the exit and European equities still bid. Risk is being trimmed at the edges, with crypto held closest to the exit and European equities still bid. Our rule-based simulation book tells the same cautious story. Sim equity stood at 4,019.88 USD, unchanged against the same time yesterday, with 2,014.07 USD parked in cash. The latest logged decision was WATCH KWEB at 0.00 — a recorded decision to do nothing. The busiest signal channel of the day was “central banks”, with 4 events. The regime reading came in at trend=falling, level=3.63.
The textbook reflex says trimmed equity risk should flow into the deepest, most liquid safe asset, a Treasury. On Friday the long end offered little bid at all, and that is the crack in the familiar story.
A 5.087 print that would not budge
The benchmark US 10-year Treasury yield was unchanged at 5.087 per cent, after earlier rising to 5.1334 per cent. [1] The 30-year rose 0.5 basis point to 5.433 per cent, after trading earlier at 5.464 per cent. The 2-year, the maturity that tracks rate expectations most closely, fell 3.2 basis points to 4.719 per cent, after earlier touching 4.783 per cent. A long end that refuses to rally while the short end eases is not a classic haven day. It looks more like a repricing of the policy path than a flight out of risk, and the short end confirms it.
The weekly picture holds the real surprise. Ten-year yields were headed for their biggest weekly drop since the week ended August 1, 2025. The benchmark swung between a high of 5.329 per cent on Wednesday and a low of 5.037 per cent on Thursday before drifting through Friday. A round trip of roughly 29 basis points inside two sessions is not calm; it is a market arguing with itself in public.
Two market practitioners put the week in words:. I don’t see anything that’s changing the fundamental trend direction in the case of yields.” — Matt Weller, global head of market research at StoneX in Michigan [1] > (2) “There’s a ton of competing undercurrents beneath the Treasury market that are pushing and pulling the long end of the yield curve in different directions and quite a bit of volatility intraday.” — Michael Reynolds, vice president of investment strategy at Glenmede in Philadelphia [1]
The mechanism: a curve, not a level
The cleanest way to read Friday is to focus on the spread rather than the 10-year alone. The gap between 2-year and 10-year yields stood at a positive 36.6 basis points, a closely watched slice of the curve treated as a gauge of economic expectations. Positive but historically thin means the market is not pricing a collapse; it is pricing a slower path for policy, with term premium still doing work at the far end.
Inflation expectations supply the second half of the mechanism. The 10-year TIPS breakeven rate last sat at 2.347 per cent, which implies the market sees inflation averaging about 2.3 per cent a year over the next decade. That is not a panic number. It is an anchor that makes long-dated nominal yields sticky: if expected inflation is stable, a long yield only falls when real yields fall, and real yields only fall when growth or policy expectations shift.
Policy expectations are where the short end gets its instruction. Investors have increasingly bet that the Federal Reserve’s next rate hike will not come until December, and some were disappointed by the lack of guidance from Fed Chairman Kevin Warsh, who said he does not prejudge interest-rate decisions. The move this week suggests the disappointment was about guidance, not direction.
In plain terms, the channel is simple. A 2-year yield falling 3.2 basis points is the market saying: less tightening ahead. A 30-year yield rising half a basis point is the market saying: we still want compensation for duration. Both can be true at once. That is why the 10-year’s flat print looks like indecision and is actually two forces cancelling out.
Who wins, who pays
Those two forces have different clients. The first is defensive money that needs a home; the second is valuation money drawn in by yields at their highest levels in decades. They arrive at the same market for opposite reasons, which is exactly how a curve gets pulled in two directions at once.
- Duration holders get a modest tailwind from any pause in hikes, but the 30-year’s 0.5 basis point rise shows that compensation for holding long paper is not being given away.
- Borrowers tied to the short end are the quiet beneficiaries of a 2-year at 4.719 per cent rather than 4.783 per cent.
- Equity risk is where the cost shows up, and our own tape agrees: NVDA, MSFT, TSLA and KWEB all closed nearer their lows than their highs, while gold managed a small positive at 4,181.10.
- Commodity and supply-side stories keep competing for the same attention. The same wire that carried the Treasury numbers also carried Hardeep Puri’s announcement of 85 K crore of support for oil exploration — a reminder that headlines arrive in parallel and capital has to choose.
- The decider remains the Fed.
What to watch next
Three levels and one date. The week’s brackets of 5.037 per cent and 5.329 per cent on the 10-year are the honest boundaries of the current argument; a close outside them would say which side won. The 2s10s spread at 36.6 basis points is the growth-expectations tell. The breakeven at 2.347 per cent is the inflation anchor, and any sustained move there would change the whole calculation.
The date is December. If investors are right that the next hike waits until then, the short end should keep easing and the curve should keep steepening gently. If they are wrong, the 2-year snaps back and the 10-year gets tested again.
Sim equity at 4,019.88 USD is flat, half the capital sits in cash at 2,014.07 USD, and the most recent logged action was WATCH KWEB — a decision to wait.
Both readings fit the same 5.087 print.
At 16:48 UTC the screen still printed 5.087, unchanged, holding its line while everything around it moved. The next test is December, and the curve will tell us which side of the argument won.