
A Natural Experiment Nobody Planned
The COVID-19 lockdowns of early 2020 were a catastrophe in almost every sense. For fire scientists, they were also something close to a gift: a global pause button pressed on human movement while the weather kept running its normal course. That accidental separation of people from climate is what makes the study led by Jianghao Wang, a professor at the Chinese Academy of Sciences, possible at all. [1] Without it, the two influences are tangled so tightly that no one can pull them apart.
The logic is almost embarrassingly simple. Human activity and climate normally rise and fall together. Seasons shape both fire and human behavior. Farming calendars shape both. Weather shapes both. Wang put it plainly: “Human activity and climate normally vary together, because seasons, farming calendars, and weather all shape both fire and human behavior. The early-2020 lockdowns produced an abrupt, large-scale drop in human mobility, and the timing differed across countries while the weather did not change in the same way. This gave us a natural experiment.” [1] To measure the pause, the team checked regional lockdown orders and mobile phone location data. To measure the fires, they used the VIIRS sensor aboard the Suomi NPP satellite, operated by NASA and the National Oceanic and Atmospheric Administration. That sensor spots heat signatures at a spatial resolution of 375 meters. Each hot spot counts as one active-fire detection, which means a single large blaze can register as many spots. The instrument cannot tell a wildfire from a prescribed burn. The intent behind every flame stays invisible to it.
The comparison was built week by week. Detections during the 2020 restriction periods were set against the same weeks in 2013 through 2019. Weather conditions were not identical across those years, so the team adjusted for them. That adjustment turned out to matter enormously.
The Number That Doubled When Weather Was Removed
Areas under lockdown in the first half of 2020 recorded about 12.3 percent fewer active-fire detections than the recent-past average. That is the headline figure. What sits behind it is more interesting. Without the weather correction, the decline was only 5.8 percent — a result that was not statistically significant. After controlling for weather, the estimate rose to 12.3 percent. The source notes that if weather in 2020 were more favorable to fires than in previous years, it might have masked some of the human impact. Removing the mask doubled the apparent effect.
The drop was not spread evenly across the landscape. Forests showed a decrease of about 27.7 percent. Grasslands fell by 8.4 percent. Shrublands, savannas, and croplands showed little difference. The researchers read this pattern as evidence that humans are a major cause of fires in forests and grasslands specifically — the places where a dropped cigarette, a spark from equipment, or a stray campfire has the most to work with.
It is a net figure, and the word “net” is doing heavy lifting. Restricting human activity cut the number of fires people started. It also cut the number of fires people put out. Two opposing forces partly canceled each other, and what remained is the 12.3 percent. Wang was explicit about the limit: “The 12.3 percent is a net effect, not the share of fires caused by humans; opposing changes in ignition and suppression mean it does not capture the full magnitude of human influence.” [1] The researchers also examined 12 countries with records of prescribed burning. The area burned by prescribed fires in 2020 fell by roughly half compared with the 2013-2019 average. When those prescribed-burn areas were excluded from the analysis, the decline in those 12 countries shrank from 45.3 percent to 27.8 percent. Part of what looked like a fire reduction was simply fire that was never deliberately lit.
Where the Fires Went Up Instead
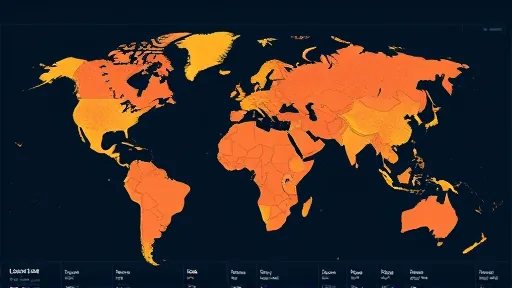
Not every region followed the script. Most of South America, southern Africa, and northeast Asia saw fires increase during the lockdowns. Colombia recorded a rise of 31.4 percent, India 25.4 percent, and Honduras 70.7 percent. These are the places where the net effect flipped sign.
There are no direct field data explaining why. The team inferred that weakened fire suppression produced more fires in these locations. Wang said: “It is an inference, not a direct observation.” Part of that inference rests on earlier work suggesting that weaker fire management in Colombia and Madagascar contributed to increased fires.
A second line of evidence comes from how fires responded to different degrees of mobility loss, measured in 0.5-degree grid cells. In countries with fewer fires, fire counts fell in an almost straight line as mobility dropped. In countries with more fires, counts crept upward and then leveled off at about 27 percent on average as mobility fell. The researchers read the straight decline as fewer human-driven ignitions and the gradual rise as weakened suppression. Wang allowed that other explanations exist, including shifts in local land use.
The study carries acknowledged limits. Mobile phone data may miss activity in rural areas where coverage is thin. The analysis covered only the first half of each year, so regions whose fire season peaks later — the western United States among them — were not fully captured. And the design, however clever, delivers strong associational evidence rather than a controlled experiment. Wang called it a quasi-experimental design.
What the work rules out is the idea of a single fix. Where fires fell, human ignition appears to dominate, pointing toward public education and maintained prescribed burning. Where fires rose, reduced monitoring and suppression appear to be the lever, pointing toward keeping firefighting and patrol capacity intact during disruptions. Wang’s summary: “Overall, a uniform policy is unlikely to work, and strategies should be tailored to local human-fire relationships.” Fire-risk projections, he adds, might do well to fold human behavior into their models — so that forecasts stay accurate as both the weather and the people beneath it keep changing.