The Barometer and the Weather: Why the Stock Market Reports Less on the Econom
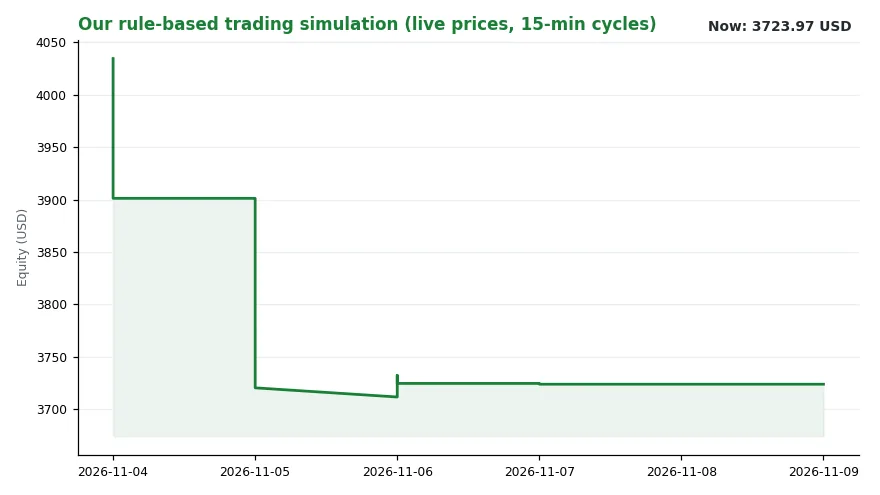
y Than It Used To Gold is trading near the top of its daily range — 4,139.70 dollars an ounce, up 1.59 percent, at 96 percent of the session’s range (position of the price between the day’s low (0 %) and high (100 %)). That is the cleanest signal on our watchlist right now: a bid for shelter, pressed right up against the day’s high. NVDA sits at 186.64, up 2.78 percent, yet near the day’s lows at 15 percent of its range — a gain that has already been sold into. TSLA at 358.22 is up 4.23 percent and parked mid-range at 65 percent. ^GDAXI at 25,820.36 is down 1.92 percent, mid-range at 46 percent, with European exposure offered while US growth names hold. Our rule-based sim book — our simulated, rule-based model portfolio in which trades are only logged, not executed — reads 3,723.97 dollars, flat against the same time yesterday, with 1,863.17 dollars in cash; the latest logged decision was WATCH KWEB at 0.00. The regime reading — our internal score that classifies the market environment as rising or falling — puts the trend at “falling” with a level of 3.63.
Six readings, one pattern: rotation without conviction. Shelter is bid. Two growth names are green but not pressing their highs. Europe is for sale. Cash sits idle in the sim book rather than being redeployed. Nothing in that picture looks like a market buying the whole economy at once — and that is precisely the subject of the news we are looking at today.
What the column actually found
The piece, published by MarketWatch and distributed through Dow Jones Newswires, opens with a line that doubles as its thesis: “There is a wide disconnect between Wall Street and Main Street, and AI could drive them even further apart” [1]. Its author, Mark Hulbert, gives the phenomenon a name — “something I call the Wall Street-Main Street disconnect” — and then dates it with two numbers that carry the whole argument. [2] Between 1900 and 1960, 84 % of bear markets — a prolonged fall in prices, conventionally 20 % or more from the peak — coincided with a recession. Since then, the comparable proportion is just 30 %. Same asset class, same country, radically different relationship to the real economy.
The column does not stop at bear markets. It also tracks the correlation — a statistical measure of how closely two series move together, from −1 to +1 — between the growth rates of GDP and the S&P 500’s earnings per share — a company’s profit divided by its number of shares. That correlation has been in a steady downtrend for six decades, with only one notable interruption — a blip upward during the global financial crisis. So the loosening is not a single episode. It is a trend line.
Hulbert then asks the obvious follow-up question: if the economy explains less, what explains more? His answer names two culprits. The first is profit margins, which mean a dollar of revenue now translates into more earnings than it once did. The second is price/earnings multiples — the price of a share divided by the profit per share, i.e. how many dollars investors pay per dollar of earnings — which mean a dollar of earnings now translates into a higher share price. Both have been climbing for years.
To show how much heavy lifting those two factors do, the column runs a back-of-the-envelope counterfactual. Had margins and multiples stayed constant over the past decade, the S&P 500 would today be 45 percent lower. Not flat. Not modestly weaker. Roughly 45 percent lower.

The final piece of evidence is a divergence between what indices print and what households report. The consumer sentiment index — a survey measure of how households feel about their finances and the economy — hit an all-time low of 44.8 this summer; the previous low was 50 in mid-2022; the index now sits at 48.0, only marginally above that summer trough. Meanwhile, incumbent politicians — including the current president — celebrate stock market highs. That is the disconnect in a single frame: record prices on one screen, near-record gloom on the other.
The mechanism: from GDP to margins and multiples
The transmission channel here is not interest rates, not regulation, and not supply and demand in any simple sense. It is corporate pricing power and valuation.
Stage one: revenue becomes earnings at a rate set by the margin. Stage two: earnings become price at a rate set by the multiple. If both rates drift upward for years, the index can compound even while the underlying economy grows slowly. The link between GDP and the index does not break; it gets buried under two rising multipliers.
That is why the falling correlation between GDP growth and earnings-per-share growth matters more than any single quarter’s GDP print. The economy still feeds the system. It just no longer sets the gain.
Different assets are pricing different futures, and a single macro number cannot reconcile them: gold presses its high while the German index is offered, and both readings come from the same morning.
Hulbert is explicit that this is not a claim that the economy has stopped mattering: “This doesn’t mean that the strength of the economy has no impact on the stock market.” [2] The claim is narrower, and stronger — that the correlation is declining, and that the decline is profound.
Who gains, who loses, who decides
Winners, on the column’s own logic, are companies with expanding margins and the valuations that follow from them. In the AI scenario the piece sketches, the winners are narrower still: AI companies whose “profits mushroom” even as “millions of jobs are lost and unemployment skyrockets.” Losers are the households behind that 48.0 sentiment print. Also exposed are investors who treat recession calls as a timing tool — the column’s practical conclusion is that they should worry less about whether a recession is imminent or how fast the economy is growing, and more about margins and multiples. Anyone watching GDP as the master signal is watching the wrong dial.

Deciders are diffuse. No single authority sets a profit margin or a market multiple. Margins come out of pricing power across thousands of firms; multiples come out of what buyers are willing to pay for a dollar of earnings. That is exactly why the disconnect is hard to legislate away — there is no lever to pull.
What to watch next
Three observables, honestly uncertain.
First, margins. If they stop climbing, the first amplifier stalls and the old GDP link becomes visible again. Second, multiples. A sustained de-rating — a lasting fall in the multiple investors pay for a dollar of earnings — would do the work that a recession once did. Third, the sentiment gap. Watch whether the spread between index highs and consumer-sentiment lows narrows — or widens. A widening gap is the disconnect becoming structural rather than cyclical.
The column presents the dystopic outcome as a scenario, not a forecast: AI “may very well accelerate” the disconnect, and if profits mushroom while unemployment skyrockets, the disconnect “would become complete.” [2] That is conditional language, and it should be read as such. What is speculative is how far AI pushes both.
In our own data, the tell would be persistence: gold holding near the top of its range across several sessions while equity indices make new highs. Today’s reading is a single frame, not yet a trend — gold at 96 percent of its range is one session, and one session is data, not a conclusion.