
The 7 Percent Line
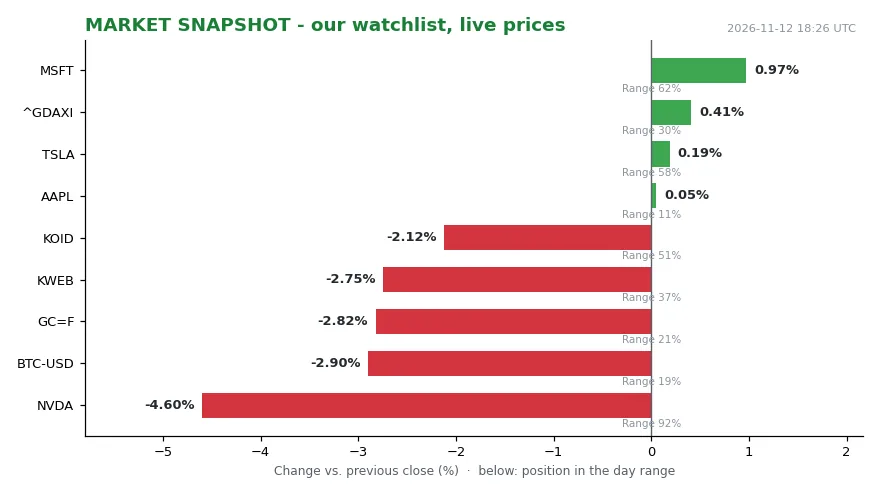
At 18:23 UTC on 12 November, our watchlist showed a market rearranging itself rather than simply falling. Nvidia printed 165.46, down 4.76% on the previous close, yet sat at 91% of its daily range — near the high, which means the selling came early and buyers worked the rest of the session. Apple was effectively unchanged at 355.48, up 0.03%, but pinned at 9% of range, close to its low. Microsoft moved the other way: 526.29, up 0.99%, mid-range at 64%.
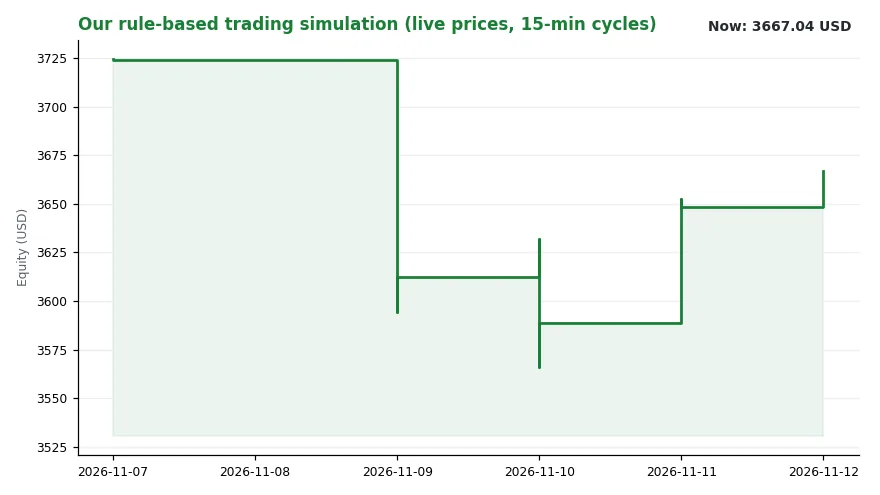
The pattern is rotation, not liquidation. Gold at 3884.80 and bitcoin at 71795.52 both fell close to 3% — 2.89% and 2.88% respectively — and both finished at 19% of range, near the lows, with no late bounce. Tesla was flat at 391.38, up 0.14% and mid-range at 56%, while the DAX added 0.41% to 26771.88. Our regime reading for the session was trend=falling, level=3.63. The busiest signal channel on 11 November was “other”, with six events, and the DAX closed at 30% of its range. The simulated book stood at 3662.30 USD, 0.38% above the same time a day earlier, holding 1839.73 in cash and a standing decision to watch KWEB at 23.02, down 2.72%.
Two assets with no direct link to Arizona subdivisions fell together near their lows while a software mega-cap rose. Read as a pattern, that shape fits a market repricing the cost of money rather than a market repricing growth. One session cannot prove that link, and we do not claim it does. It is, however, the direction of travel that the housing data released the same week describes in slower motion.
The line that broke
The number that crossed a border arrived in September, and the border was 7%. The 30-year fixed mortgage rate topped that level for the first time in nearly two years, and in the same month pending home sales — contracts signed but not yet closed — fell to the lowest level in the National Association of Realtors’ history.
October’s closings then confirmed the crossing. Existing home sales ran at 3.75m units, down 8.8% from a year earlier and the weakest reading since August 2010 — a 16-year low. The median existing-home price edged up to $416,700. Sales fell in the midwest, the south and the west, while the north-east held steady.
The context is what makes the level unusual. Mortgage rates had been declining through 2024 and 2025. In February 2026 the 30-year rate fell below 6% for the first time. Then inflation rose and interest rates climbed amid the Iran war, pushing the same rate back to a nearly three-year high. It now hovers around 7.18%, not far from the 2023 high of 7.79%. During the pandemic, the average was just above 3%.
The headline calls these record-high mortgage rates. The underlying detail is more precise: 7.18% is the highest since 2000 apart from a single month in 2023. That is a record in the sense that matters to someone signing a 30-year contract, and not a record in the sense of an all-time peak.
The NAR’s chief economist, Lawrence Yun, framed the arithmetic directly:.” [1]
“As a result, home sales fell to their lowest level since August 2010.” — Lawrence Yun, chief economist, National Association of Realtors
The volume figure carries the news; the price figure complicates it. A median that rises slightly while transactions fall by 8.8% does not fit a simple story of collapsing prices. It is a distribution fact, and we read it as such rather than as a verdict.
How a rate becomes a sales number
The transmission channel runs through the Federal Reserve. Mortgage rates, the report notes, have been directly affected by the Fed’s interest rate changes. The central bank raised rates in September, its first hike since 2023, leaving the policy range at 3.75% to 4%. It is poised to raise again next month to combat inflation, which rose more than expected in October.
From there the chain is short. A higher policy rate raises the cost of the loan that finances the purchase. The monthly obligation on a given loan is larger at 7.18% than it was at the pandemic-era rate just above 3%, against an asking price that has not fallen. At the margin, buyers step away, and the October count is what that looks like in aggregate: 3.75m units, 8.8% fewer than a year earlier. This is a financing-cost channel, not a demand-collapse story, and the two should not be confused.
Pending sales are the leading edge of the same chain. They measure contracts, not closings, so September’s record low arrived before October’s closings were counted. That ordering matters: the pipeline emptied first, and the completed transactions followed.
Danielle Hale, chief economist at Realtor.com, offered a competing reading of the same numbers [2]:
“I don’t think this is a new normal for home sales.” “Instead, it reflects a perfect storm of an abrupt shift in the financial environment and large uncertainties in the pre-election period for both policy and the economy just as the housing market usually slows for the season.” — Danielle Hale, chief economist, Realtor.com
Her reading is a claim about duration, and duration is exactly what a single month of data cannot settle. It is also the most testable claim in the release: either sales normalize once the financial environment stops shifting, or they do not.
Who wins, who loses, who decides
What it does is distribute outcomes across groups. A buyer at 7.18% faces a different monthly cost than a buyer at just above 3%, and the 8.8% annual drop in sales is the aggregate of those individual decisions. Sellers still saw the median price edge up to $416,700, which is not what a distressed market looks like.
Renters appear in the latest census data, where growth in median rent outpaced inflation and the homeownership rate has stagnated since 2021. We read that stagnation as the slow version of the story the sales count tells in a single month — an interpretation, not a finding of the release.
The decision-maker is the Fed. Its next move is flagged as another hike, which means the mortgage rate that matters in December is not set in the housing market at all. Politics sits close behind. Affordability and cost-of-living concerns played an outsized role in the midterm elections that gave Democrats control of Congress next year. That makes the same arithmetic a political fact as well as an economic one, though the release does not say what Congress will do with it.
Our own tape offers the market’s side of the ledger. Gold and bitcoin near the bottom of their ranges, Microsoft higher and mid-range — those are measurements taken in one session, and we treat them as measurements, not as a forecast. The simulated book’s cash balance of 1839.73 and its watch-only stance on KWEB are a documented exercise, not a recommendation. Nothing here is investment advice.
What we watch next
Three numbers carry the next chapter. The first is the Fed’s December decision, which the report already flags as a likely hike. The second is the 30-year rate against two markers: 7%, the line September crossed, and 7.79%, the 2023 high. The third is pending sales, the earliest clean signal of whether October’s 3.75m was a floor or a step.
A seasonal slowdown is already part of the picture, so a weak winter print would be ambiguous evidence. A weak spring print would not be.
The mechanism is monetary and the constraint is affordability, and both are observable again next month.
The Queen Creek subdivision photographed on 14 October 2026 — the image that ran with the report — is the picture of the thing itself: houses that exist, buyers who must borrow to reach them, and a rate that decides how many can. Sources: [1] Lawrence Yun, National Association of Realtors, October existing-home sales release. Danielle Hale, Realtor.com, same release. Market measurements: our watchlist and simulated book, snapshot 2026-11-12 18:23 UTC.