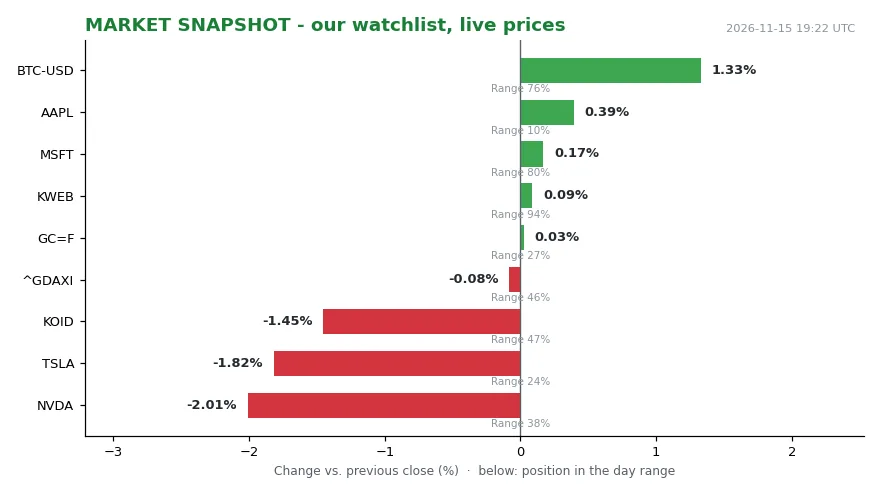
Our own tape, pulled two minutes before this was written, shows BTC-USD at 64,938.58 — up 1.28% against the previous close and sitting at 75% of its intraday range. NVDA trades at 162.85, down 2.01%, stuck mid-range at 38%. TSLA is at 390.22, off 1.82%, close to the day’s lows at 24% of range. MSFT prints 523.88, up 0.17%, near the day’s highs at 80%. KWEB sits at 22.93, up 0.09%, at 94% of its range.
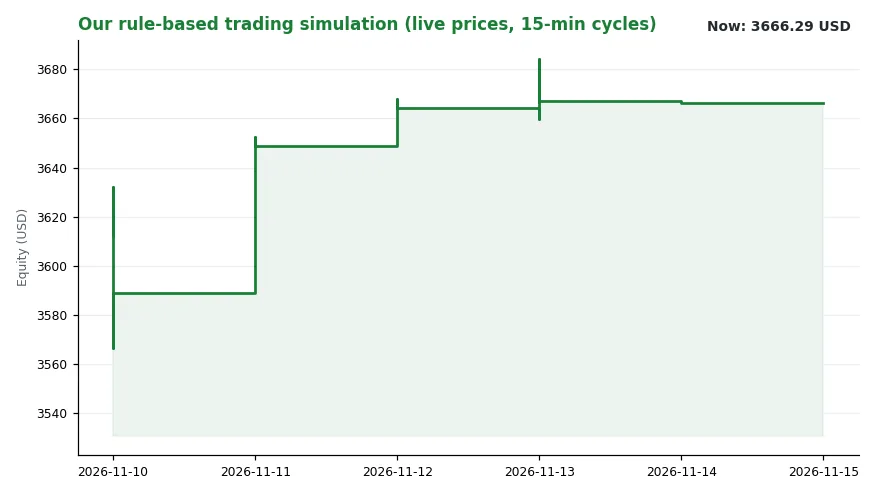
That pattern reads as rotation, not as risk-on. The soft end is AI hardware and autos. The firm end is software and China internet. Bitcoin is neither leader nor laggard here — it is a coin catching one green session inside a downtrend. Our regime reading — our house index of the market’s current state — agrees: trend=falling, level=3.63. The sim book holds 3666.29 USD of equity, flat against the same time yesterday, with 1839.73 in cash and a WATCH on KWEB as the latest rule-based decision. The busiest signal channel on 14 November was “central banks,” which fits a week in which the ten-year yield did more to set Bitcoin’s price than any crypto headline.” Five weeks of losses, five rounds of borrowing, and four prior rounds that each ended in more than $800 million of liquidated long positions.
What Bitfinex counted
Bitfinex analysts count five separate waves of borrowing into a declining Bitcoin market since early October. The first four each finished with more than $800 million in long liquidations. The fifth wave began after Bitcoin closed its fifth consecutive losing week at $74,754 on 8 November 2026. On 10 November, Bitcoin traded at $73,227 — down 2.6% over the past 24 hours and 5.6% for the week.
The market did not hold there. By the morning of Saturday, 14 November, Bitcoin traded at $66,485 — 3.96% lower in 24 hours and 12.26% lower over seven days, and it has not recovered since: our own tape shows $64,938.58, 1.28% above the previous close but still deep inside the same downtrend. It had still been above $70,000 earlier that week. As recently as 21 October it closed at $84,082.27. The coin now sits 47.27% below its record of $126,080, set on 6 October 2025, down 29.85% over a year and 24.08% year to date — the change since 1 January of the current year. Market cap — price multiplied by coins in circulation — is roughly $1.34 trillion.
The setup is therefore straightforward and uncomfortable: traders keep adding borrowed exposure while the price keeps making lower closes, and the fifth round began at a lower price than any of the first four.
The channel: liquidation prices stacked under the market
Leverage means borrowing to enlarge a position. A trader posts collateral; the exchange lends the rest. Every borrowed position carries a liquidation price — the level at which losses eat enough collateral that the exchange automatically sells the position to recover the loan. In a falling market, those forced sales add to the selling, which pushes price toward the next cluster of liquidation levels. Bitfinex analysts attribute the outcome of the first four borrowing episodes to exactly this chain reaction.
Two data points describe the fifth round. Open interest in Bitcoin futures on CME Group — the total number of futures contracts still open — dropped about 15% between 3 and 8 November, while offshore positions increased. CME is the regulated venue where larger U.S. institutional players operate, so that divergence points to institutions cutting exposure while offshore traders add it. On OKX, open interest in Bitcoin perpetual contracts — futures contracts with no expiry date — rose to 36,220 BTC — roughly $2.65 billion — on 10 November, up from 35,499 BTC the day before. A similar pattern showed up earlier in the month on Hyperliquid.
The honest caveat is baked into the instrument. Open interest does not reveal who holds which side; every contract has a buyer and a seller, so rising open interest can mark new longs or new shorts. Bitfinex reads the current mix as weighted toward longs. OKX’s data covers only part of offshore activity.
A second channel is running in parallel: spot ETF flows (spot ETFs are funds that hold actual bitcoin and whose shares trade like a stock). Cumulative net inflow into spot Bitcoin ETFs peaked at $57.96 billion on 21 October and had fallen to $54.63 billion by 13 November. Total net assets dropped from $109.31 billion to $86.20 billion over the same stretch. The last three sessions all lost money — $299.90 million, $284.00 million and $185.45 million — after a worst day of $643.33 million in outflows on 30 October.
A third channel is the rate complex. The 10-year Treasury yield — the interest rate the U.S. government pays on ten-year debt — reached 5.10% on 12 November, up from 4.84% on 5 November, while the Fed’s target rate upper limit has sat unchanged at 4.00% for a month. Goldman Sachs added another rate hike to its Fed outlook after hot inflation data. A government bond paying above 5% is a competing asset, and that competition does not need a narrative to work.
Who believes what, and which evidence carries weight
The bottom-calling school argues that borrowing into weakness is a confidence signal — traders buying what they believe is a low, as the source puts it. The school has an obvious cost: four cohorts have already been wiped out making that same bet.
The liquidation-trap school, which is Bitfinex’s reading, argues that leverage has not cleared and steadier money has not returned, so the fifth round simply adds fuel for another leg down.
The flow-and-rates school ignores the futures book and points at the ETF outflow sequence and the 5.10% yield, treating both as the reason bids are thin — a reading that follows from the source’s own ETF and Treasury figures rather than from Bitfinex’s positioning work.
The evidence that decides between them sits in holder cost basis — the average price a group of buyers paid. Bitfinex analysts note that 8 November marked the first close below the short-term holder cost basis of $75,893 during this uptrend. [1] That cost basis is the average price recent buyers paid; many are underwater and have been selling to cut losses. A prior rally stalled at $81,300 as October buyers exited at breakeven.
History offers a number, and the source itself undercuts it. Bitfinex puts the median move four weeks after past five-week losing streaks at a 14.1% decline — but every prior streak occurred during a bear market or capitulation phase, and the analysts still classify the current decline as a correction. [1] The historical pattern applies only if this pullback turns into a bear market.
Positioning data caps the optimism further. Options traders price a narrow week:
[1] “We expect bitcoin to trade within the $72,350 to $79,400 range implied by options for the 13 November expiry, and to spend most of the week in its lower half.” [1]
A drop to $72,350 would break the long-term trend line.
Cross-asset linkage matters too. Bitfinex reports a 0.72 correlation between Bitcoin and the Nasdaq-100, where 1.0 is perfect, and links the recent decline to a post-midterm sell-off in AI stocks ahead of an anticipated CPI inflation report.
Who carries the risk
Offshore perpetual traders on OKX and Hyperliquid hold the fresh borrowed longs and therefore the liquidation prices. Recent spot buyers sit below their cost basis and are the marginal sellers. ETF holders have been net redeemers for three straight sessions. The Treasury market, the Fed and Goldman’s revised rate outlook set the discount rate against which a non-yielding asset is priced.
Holders of ten-year government paper at 5.10% have been paid to wait.
What we watch next
Three markers, all from Bitfinex: CME open interest starting to rebuild, OKX perpetual open interest dropping below 35,499 BTC, which would signal that borrowed longs have been cleared out, and a weekly close above the $75,893 short-term holder cost basis, which would be the first sign that recent buyers are no longer underwater. A move below $72,350 would confirm the bearish case.
Nothing above is a recommendation; it is a map of levels and of who is standing where.