
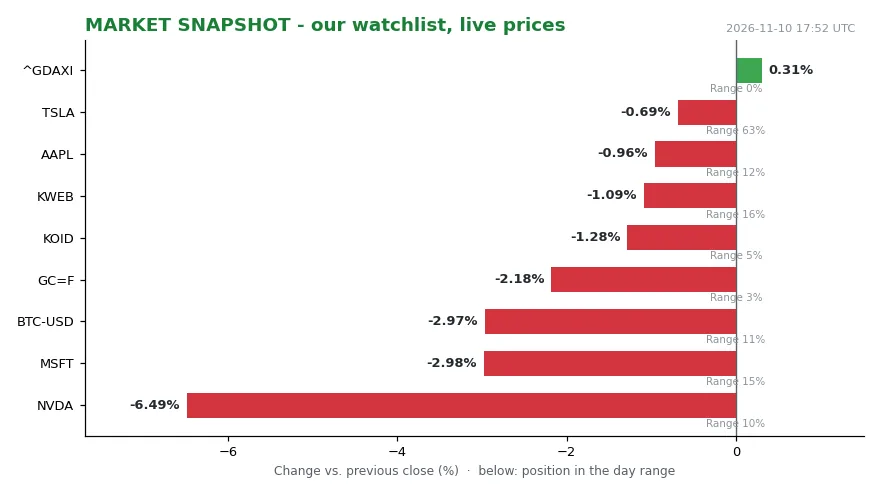
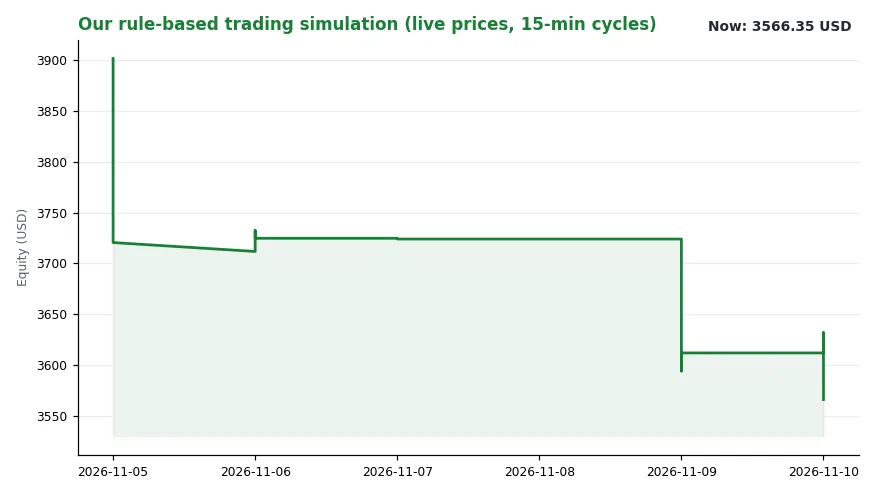
Our own session data opens with a puzzle rather than a headline. NVDA closed at 167.08, down 6.49 percent against the previous close and pinned in the bottom tenth of its daily range. MSFT lost 2.90 percent and also finished near its lows, with only 17 percent of the range beneath it, the same range position as Apple. Gold, GC=F, printed 4023.70 for a loss of 2.21 percent, just 2 percent off the floor of its range. Bitcoin traded at 73015.62, down 2.97 percent, again in the lowest decile. Apple slipped 0.84 percent and Tesla 0.78 percent, the latter mid-range at 59 percent. The DAX was the only green line on the watchlist at 26347.45, up 0.31 percent, and it too closed at the very bottom of its range. Our simulated equity book stood at 3566.35 USD, 1.27 percent below the same time yesterday, holding 1806.93 in cash after a watch decision on KWEB at 24.04, which itself fell 1.09 percent.
That is not rotation. Rotation leaves winners behind. What our tape shows is correlated de-risking, with equities, gold and crypto all sliding toward their lows in the same session. Our regime reading puts the trend as falling at level 3.63, and the busiest signal channel of the day was “central banks,” with three events.
Now set that against the number most households actually read. The national average price of regular gasoline fell below $4 a gallon for the first time since July, reaching $3.9788 on Tuesday, according to AAA [1]. That is about 17 cents lower than a week earlier and nearly 39 cents lower than a month earlier [1].
Two measurements, one day, opposite directions. The distance between them is where the story lives.
The print behind the pump
Start with the inflation data, because that is where the link to markets turns mechanical. Energy prices increased 0.7 percent in October [2]. That is a fraction of the 5.2 percent surge recorded in September [2]. The gasoline index inside the same basket rose 1 percent over the month, after advancing 9.1 percent the month before [2]. Deceleration, in other words, not deflation.
Behind the pump price sits crude. Brent briefly fell below $90 a barrel on Tuesday, the first time since August, after comments from U.S. President Donald Trump fueled hopes for an end to Washington’s nearly nine-month conflict with Iran [3]. Physical supply moved with the paper price. Crude exports from the Persian Gulf have returned to an estimated 80 to 85 percent of prewar levels, pipeline shipments included, according to ING [4].
ING’s commodity analysts framed that same signal in their own words:
“Energy markets remain under pressure as hopes for a de-escalation in the Middle East reduce geopolitical risk premiums. Oil extended its losses as Gulf supply flows continued to recover, while European gas also moved lower,”
Bespoke Investment Group supplied the sobering part of the arithmetic. Gasoline prices tend to fall at this time of year, so part of the recent relief is seasonal rather than structural, Bespoke Investment Group noted [3]. The firm’s own framing deserves the full quotation:
“While lower oil prices have been a tailwind for the relief at the pump, it’s also perfectly normal for gas prices to be falling at this time of year, so if they weren’t, there would really be something wrong,”
That is a useful corrective to any narrative in which the drop is purely a victory over geopolitics.
The channel: from the nozzle to the discount rate
The transmission runs through expectations, not through the pump itself. Fuel is the most visible line in the inflation basket that households encounter weekly, and it is the first place a change in crude reaches the consumer [1]. A cheaper headline print feeds inflation expectations [2]. Expectations feed the Fed’s reaction function, the rule of thumb by which the central bank sets its policy rate in response to incoming data [5]. The reaction function feeds the discount rate applied to every asset on our watchlist, from semiconductors to gold, because a higher policy rate raises the return every investment must beat [5].
That chain explains why a gasoline average and a semiconductor multiple can appear in the same sentence. It does not explain the direction of Tuesday’s move. The relief at the pump was real, and the tape still sold off, as our own session data shows. Lower energy costs support household budgets; they also remove a hedge for anyone who owned commodities as insurance against escalation, which is why gold and crude can fall together on the same headline [3]. Both things happened at once, which is why the two numbers can point in opposite directions without either being wrong.
The Fed’s own reading is the missing piece. Waller’s Tuesday remarks carried an explicit caveat [5]:
“While I am pleased to see energy prices down from their high rates over the past week or so, they are still quite elevated relative to the start of the year, and the ultimate effect on inflation will depend on what levels are sustained,”
The emphasis falls on the word sustained. A daily average below $4 is a data point. A policy input is a level that holds, and the same remarks flag that energy shocks may have more persistent effects on inflation than they did before the pandemic [5].
Who wins, who loses, who decides
The winners are the least glamorous participants in the story. Anyone buying fuel pays roughly 17 cents less per gallon than a week ago [1]. The losers sit on the other side of the same trade. A compressing geopolitical risk premium is a cost for positions built on continued escalation, and the recovery of Gulf flows to 80 to 85 percent of prewar levels is precisely that compression [4]. Meanwhile our own book, rules-based and documented, is down 1.27 percent over the past 24 hours.
The deciders are two, and they are not the same kind of actor. The Fed determines how much of the energy move reaches the policy rate, and Waller has declined to pre-commit to a level, tying the outcome to what is sustained [5]. The physical market determines how much of the supply recovery is durable, and ING’s 80 to 85 percent estimate is the number to watch [4]. Markets price the intersection of those two judgments, usually before either has spoken clearly.
What we watch next
Three things are on our board. First, whether Brent holds below $90 or recovers, because the pump price follows crude with a lag [3]. Second, whether the seasonal decline Bespoke describes turns into something more than seasonal [3]. Third, whether our regime reading — trend falling, level 3.63 — flips before the next inflation print [2]. None of these is knowable today, and we will not pretend otherwise.
What is knowable is the difference in what the two measurements measure. A gasoline average is a stock: a snapshot of the present, revised daily by AAA [1]. An equity tape is a flow of expectations about the future, repriced continuously, and on Tuesday those expectations were repriced lower across every asset class we track. On Tuesday the present got cheaper and the future got more expensive to hold. That divergence is not a contradiction, but it is not comfortable either.
Waller’s conditional is the honest summary of where this stands: the effect on inflation depends on what levels are sustained [5]. So we keep measuring both — the pump and the tape — and we report what we see rather than what we would prefer.
The pump and the tape will both be measured again tomorrow, and the gap between them is the pattern worth watching.
Sources
[1] AAA national average gas price, $3.9788 on Tuesday; week-over-week and month-over-month declines. [2] U.S. Bureau of Labor Statistics, CPI release: energy +0.7 percent in October versus +5.2 percent in September; gasoline index +1 percent versus +9.1 percent. CNBC market report: Brent below $90, Trump comments on Iran, Gulf supply recovery, Bespoke Investment Group quote. ING commodities research, quoted in the report: Gulf crude exports at 80 to 85 percent of prewar levels; analyst commentary.
Federal Reserve Governor Christopher Waller, speech of November 10, 2026. Our own measurement, 2026-11-10 17:49 UTC: watchlist quotes, simulated equity book, regime reading, signal layer. MSN market report, “U.S. gas prices fall below $4 for the first time since July.” Washington Post business report on the same threshold.
This article is educational analysis, not investment advice.
—