
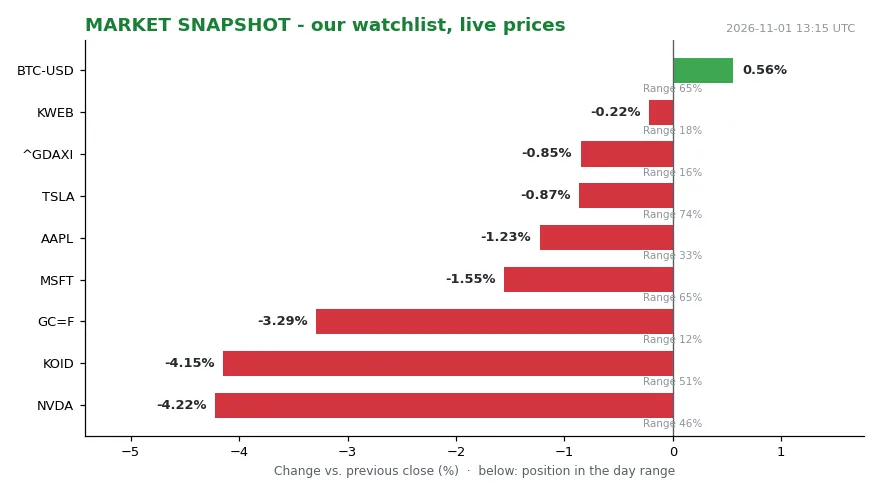
Nvidia traded at 204.64 USD, down 4.22% and parked at 46% of its daily range, where today’s price sits between the day’s low (0%) and high (100%). Gold futures sat at 3,898.90 USD, down 3.29% and pressed into the bottom of the session at 12% of range. KWEB was at 22.74, only 0.22% lower, but also near its low at 18% of range. Against that, Bitcoin held 77,861.67 USD, up 0.54% and in the upper half of its range at 64%.
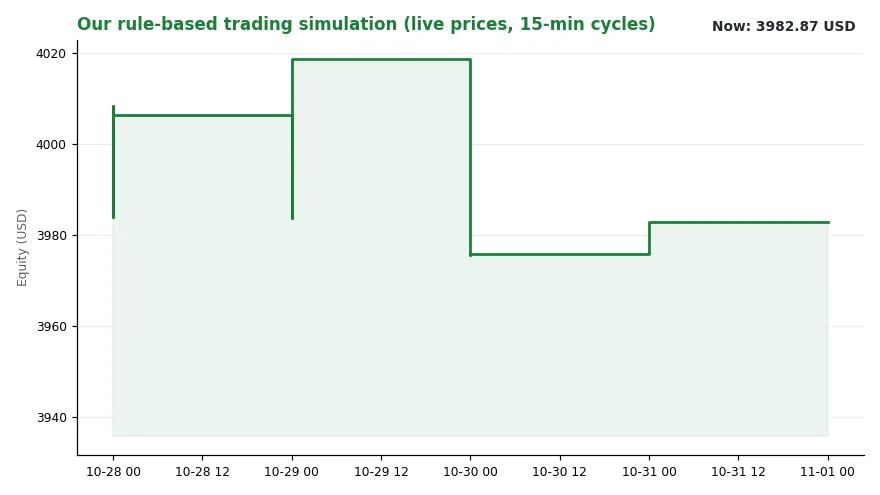
That is not a uniform risk-off session—a session in which investors sell riskier assets and buy defensive ones. It is a rotation with a hole in the middle. The metal that is supposed to protect purchasing power was the weakest of the haven assets on our board — though Nvidia’s 4.22% slide cut deeper still, while a token with no cash flows at all was the only green line. Microsoft (521.91, minus 1.55%, 65% of range) and Tesla (399.81, minus 0.87%, 74% of range) held the middle and upper parts of their ranges, so the selling looks concentrated rather than broad. Our regime reading — trend falling, level 3.63, our internal score for whether the market’s underlying direction is up, down or sideways — describes drift, not panic. And the simulated book we run, 3,982.87 USD in total equity with 2,033.42 USD in cash, sits just over half in cash, unchanged versus the same time yesterday, with the most recent decision a plain WATCH on KWEB. That cash weight is the point: the book is not positioned for a directional call on this inflation print, it is waiting for the regime reading to stop falling.
Into that tape arrived a number that got less attention than the 3.7% headline: 3.9% [1]. Here is what it is, and what it is not.
The index that decides the cheque
On October 14, the Bureau of Labor Statistics published its September inflation report, and the CPI-W — the Consumer Price Index for Urban Wage Earners and Clerical Workers — rose 3.9% from a year earlier [1]. The better-known headline CPI for the same month came in at 3.7% [1]. Price pressure in the basket tied to urban wage and clerical households therefore ran hotter than the national average, not cooler.
Why should a wage-earner index matter to anyone outside that group? Because CPI-W is the input to the Social Security cost-of-living adjustment [1]. The choice is an accident of history rather than a design decision. Until 1973, Social Security carried no built-in annual COLA at all; when Congress first enacted one that year, the CPI as we understand it today did not exist, and the CPI-W was the only consumer price index the government used to measure and track inflation [1]. The benchmark stuck, and it has been sticking ever since.
The cheque is set by an average, not by the scariest month
The formula is short and fully mechanical. Take the CPI-W readings for July, August and September, compare each with the same month a year earlier, then average the three [1]. In July 2026 the year-over-year rise—compared with the same month twelve months earlier—was 3.4%; in August, 3.5%; in September, 3.9% [1]. The average lands at 3.6%, and that becomes the 2027 Social Security COLA [1].
Then comes the multiplication that turns a percentage into a household budget line. The average retired worker received roughly 2,088 USD per month in 2026 [1]. Three point six percent of that is about 75 USD per month, or roughly 902 USD across the year [1]. The hottest of the three monthly prints was diluted by two cooler ones, and the payout follows the average, not the headline. A single scary number in September does not, by itself, move the cheque.
Why a COLA cheque and a bond yield pull in different directions
Two transmission paths run out of this report, and they behave differently.
The first is fiscal-mechanical. An indexed transfer payment—one automatically adjusted to a price index—rises automatically once the summer prints are in, and the money reaches households from the start of the following benefit year. No vote, no discretionary decision — the statute fixes the index and the arithmetic does the rest [1]. That is roughly 902 USD a year per average retired worker arriving into household budgets on a fixed date, independent of what the Fed does next. The second path is the one markets price. The source’s own read is that inflation at 3.9% does not by itself demand wholesale changes to a stock portfolio, and it notes that short-term bonds are less sensitive to the risk of rising interest rates [1]. It also flags commodities and energy stocks, financial stocks and real estate investment trusts as the categories investors sometimes use to diversify away from large caps [1].
The structural claim the source makes is that firms with high market share and pricing power—the ability to raise prices without losing customers—tend to fare better when input costs climb [1], because the ability to pass costs forward is what separates a margin problem from a margin collapse.
Inflation is not uniformly bad: some inflation signals growth and gives people an incentive to spend and invest, while deflation—a broad fall in prices, usually a sign of a shrinking economy—caused by prolonged recession, high unemployment, or a declining population is the worse problem to have [1]. And for perspective, the 3.7% headline CPI is only slightly above its past 50-year average, nowhere near the extremes of 2022 or the late 1970s and early 1980s [1].
Who collects, who absorbs
The clearest winner is the beneficiary cohort: an average retired worker collects about 75 USD more per month, roughly 902 USD more per year, starting with the 2027 adjustment [1]. That is a real, contractual increase in nominal income—income in dollars, before adjusting for what those dollars buy—and it arrives regardless of what equities do.
The clearest pressure point sits with anyone whose income is not indexed — the CPI-W measures prices, not pay, so a wage earner whose compensation lags the 3.9% print absorbs the difference. On the corporate side, the split runs along pricing power: brand strength and market share versus commodity exposure.
Policy is the third actor. The source attributes part of the current price pressure to what it calls “Trumpflation” policies, which have driven up energy prices and added tariff costs to imported products and, unless they go away, may keep prices higher [1]. That framing matters because it locates part of the inflation in policy choices rather than in demand — which means part of it is reversible by policy choices.
What we watch next
Three things, in order of information value.
First, whether 3.9% was a spike or a step. The 2027 COLA is already arithmetically settled at 3.6% by the July-to-September window [1]; the October CPI-W reading, whenever it lands, speaks to 2028 and to how markets set expectations now. One hot month is data; three would be a regime.
Second, the hedge question our own tape raised this morning. Gold down 3.29% and sitting at 12% of its range while CPI-W runs at 3.9% is a reminder that the link between an inflation print and any single “inflation hedge” is not mechanical. Correlation—how closely two assets move together—is a fair-weather friend, and one session is not evidence of anything except that the metal was sold today.
Third, the policy channel. Our signal layer recorded “central banks” as the busiest channel today, and the case rests on energy prices and tariff costs persisting [1]. If those unwind, the September print looks like a peak. If they do not, 3.6% becomes a floor rather than a ceiling. Either way, the cheque is already written; what is still open is what the market pays for the years after.