
The Record Is in the Square Metres
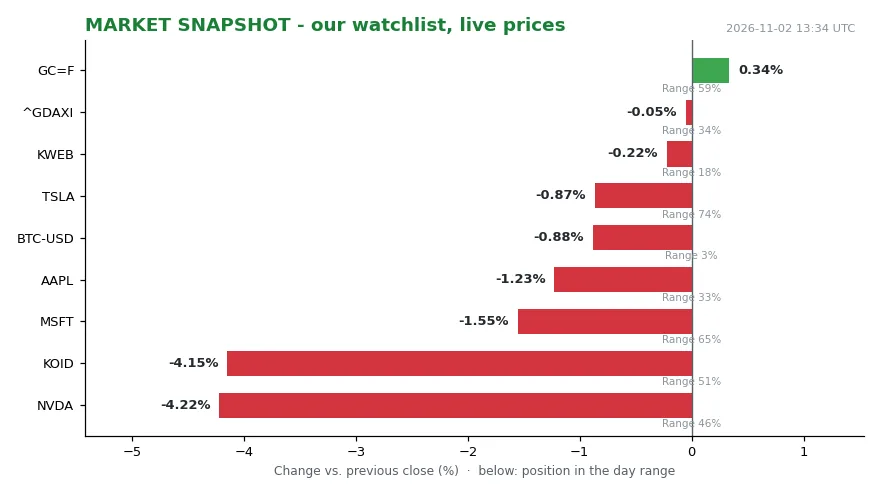
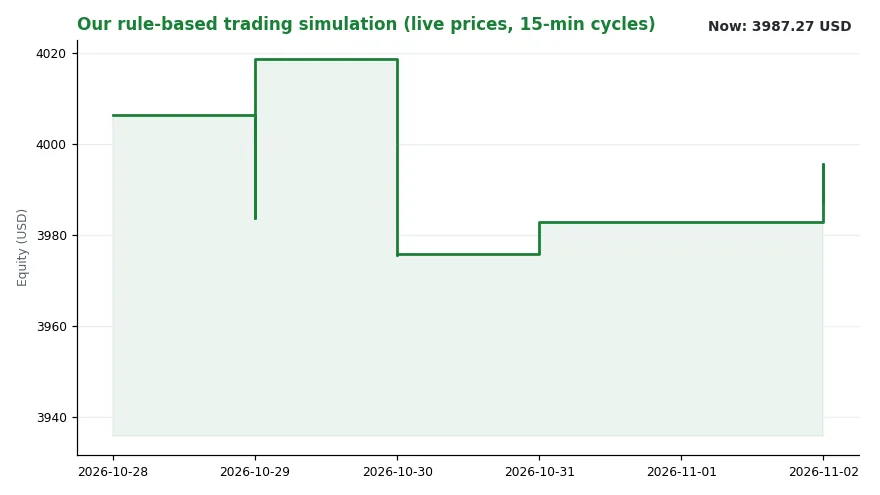
At 13:31 UTC on 2 November, our dashboard showed a market leaning back rather than breaking. NVDA printed 204.64, down 4.22 percent against the previous close and parked at 46 percent of its daily range. BTC-USD changed hands at 77,544.23, 0.88 percent lower and stuck near the day’s lows at 3 percent of range. Gold was the exception: 3,912.00, up 0.34 percent, mid-range at 59 percent. The German benchmark ^GDAXI barely moved at 25,804.40, minus 0.05 percent, 34 percent of range. Read as one picture, that is a rotation out of high-beta equity into metal, with Europe flat — a defensive tilt, not a panic. Our regime line compressed the same reading into three tokens: trend falling, level 3.63. The simulated book stood at 3,987.27 USD, up 0.11 percent on the same time yesterday, with 2,033.42 held in cash. The latest logged decision was WATCH KWEB at 0.00.
Against that tape, the week’s sharpest contrast came from a market our watchlist does not touch at all: Portuguese housing. There, prices moved the other way.
What the index actually says
The idealista price index puts the median asking price for a home in Portugal at 3,249 euros per square metre at the end of October [1]. [1] That is 7.5 percent higher than in the same month a year earlier. The index describes the move as a new record high for the series [1].
The breadth matters more than the headline. Asking prices rose in all 20 district capitals and autonomous regions the index analyses [1]. [1] That is twenty out of twenty — no flat rows, no negative rows. Five markets ran far ahead of the national print. Vila Real rose 20.3 percent year on year, Guarda 18.4 percent, Beja 17.6 percent, Leiria 16.9 percent and Faro 15.5 percent [1]. [1] The absolute levels are just as lopsided as the changes. Lisbon remains the most expensive city in the country, at a median 6,248 euros per square metre [1]. Porto follows, then Funchal [1]. Castelo Branco is the cheapest, at 1,119 euros per square metre [1]. Between the capital and that floor sits a ratio of roughly 5.6 to 1, on our own arithmetic over the index figures [1].
The regional cut repeats the city cut. The Lisbon Metropolitan Area is the most expensive region at 4,525 euros per square metre, ahead of the Algarve and the Autonomous Region of Madeira [1]. The Centre region is the cheapest, at 1,810 euros per square metre [1].
The channel: offers, not sales
One detail in the index description does most of the analytical work here: the series tracks asking prices for homes for sale [1]. That is the offer side of the market, not the settled side. An asking price is a seller’s opening position. It responds to financing costs, to expected resale value and to how thin the local pipeline of new supply looks. It does not have to clear.
So the 7.5 percent national figure measures how ambitious sellers became, and the district-level figures measure where that ambition was strongest [1]. A record on this measure is a statement about pricing behaviour before it is a statement about transactions.
The second channel is financing cost. Housing demand is among the most rate-sensitive components of household spending, because the purchase is normally levered. Our signal layer logged “central banks” as its busiest channel on 2 November, with a single event. That is a thin sample, and we treat it as such.
The third channel is dispersion itself. A national median can rise while a capital city stalls, if the smaller markets move faster. Here the smaller markets moved far faster: Vila Real’s 20.3 percent against a national 7.5 percent [1]. Catch-up and convergence look identical inside a single month’s print, and one month cannot tell them apart.
Who wins, who pays, who decides
Start with owners. Anyone holding property in Vila Real or Guarda booked a large paper gain over twelve months, measured on the offer side of the market [1]. Paper is the operative word.
Next, buyers. A household shopping in Lisbon faces a median of 6,248 euros per square metre [1]. In the Centre region, the same household faces 1,810 [1]. The gap is geography, and geography is not something a buyer can arbitrage at short notice.
Sellers set the number in this index, and sellers are the ones who moved it [1]. For developers, a rising asking price is information about what the market may bear; for licensing authorities, it is information about how much supply is actually arriving. Central banks sit upstream of all of it through the cost of credit. And the compiler decides what gets counted, which is why the methodology note — asking prices, median value — matters as much as the percentage [1].
What we watch next
Three things are worth watching.
Conversion comes first. Asking prices are the offer; transaction data is the verdict. If the offer rises 7.5 percent while volumes thin, the record is a pricing statement rather than a demand statement [1]. The index does not settle that question on its own.
Mean reversion in the leaders comes second. Vila Real at 20.3 percent and Guarda at 18.4 percent are the kind of prints that either extend or normalise [1].
The floor comes third. Castelo Branco at 1,119 euros per square metre and the Centre region at 1,810 are the cheapest entries in the table, and they tell us whether the pressure is national or metropolitan [1].
A falling trend reading and a record housing print are not contradictory. They are two different clocks: equities reprice in seconds, housing reprices in seasons. Both can sit in the same week without either being wrong, and the next print, not this one, will show which of them was early.
The index still publishes the same twenty rows, one for each district capital and autonomous region [1]. What changed is the number in the national median, which now carries a record [1]. The document did not change shape. The world it describes did.
Sources
[1] idealista price index, Portuguese housing price report — idealista.pt/media/relatorios-preco-habitacao/ “Portugal house prices hit new record as October sees 7.5% annual rise,” Euronews report Our own measurement, market snapshot of 2026-11-02 13:31 UTC (ticker quotes, simulated equity book, regime reading) Educational analysis only. No investment advice.
—