
The 40 percent line: our tape first, then Europe’s housing arithmetic
What our own numbers say
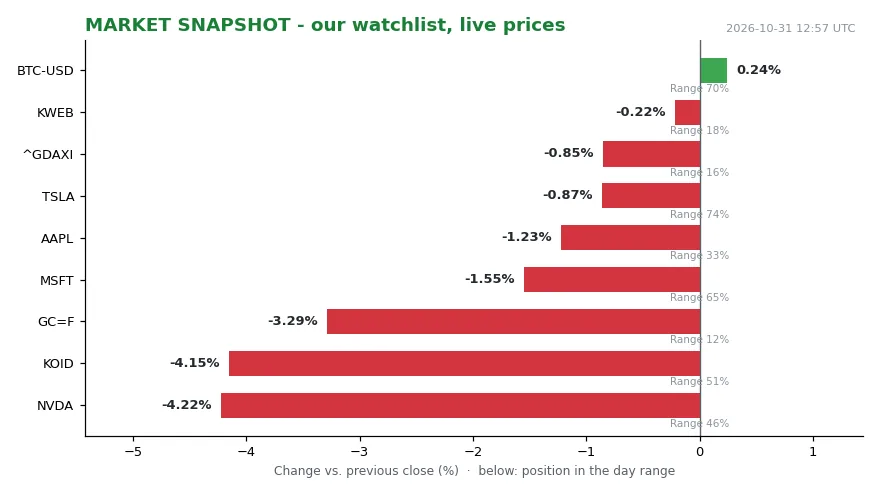
NVDA at 204.64 and KOID at 33.38 fell by almost exactly the same amount. The first lost 4.22 percent against the previous close, the second 4.15 percent. Both sat mid-range: 46 and 51 percent of the day’s span. The tape is not one story.
Gold (GC=F) at 3,898.90 fell 3.29 percent. It sat at 12 percent of range, near the low. The DAX at 25,818.21 lost 0.85 percent, at 16 percent of range. Bitcoin at 77,392.49 gained 0.25 percent, at 71 percent of range. That is rotation (money moving from one market segment to another rather than leaving), not liquidation. Money left gold and large-cap tech (the biggest listed technology companies by market value). It did not leave the market.
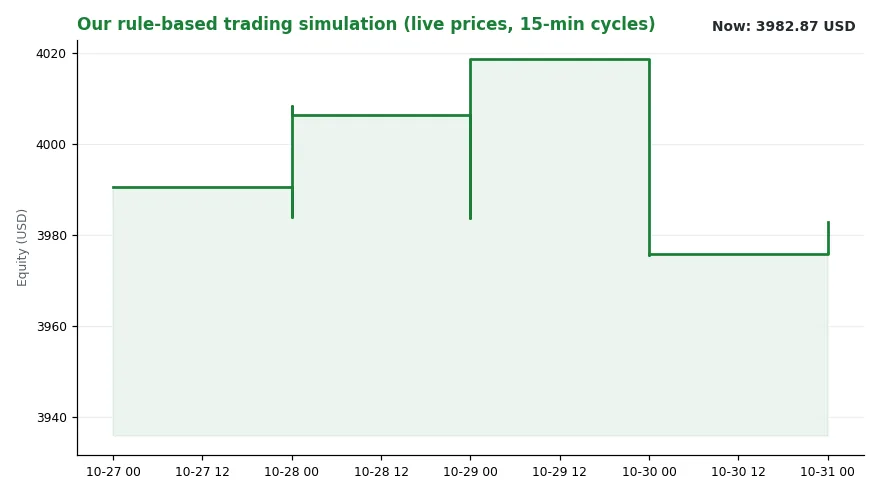
AAPL at 344.63 slipped 1.23 percent, mid-range at 33 percent. MSFT at 521.91 fell 1.55 percent, at 65 percent of range. TSLA at 399.81 eased 0.87 percent, holding 74 percent. KWEB at 22.74 was flat, minus 0.22 percent, at 18 percent of range. Simulated equity (the hypothetical account value of our rule-based model book): 3,982.87 USD, up 0.18 percent on yesterday. The latest logged decision was WATCH KWEB at 0.00. The busiest signal channel: “central banks”, one event. Regime reading (our internal label for the market’s current directional state): trend falling, level 3.63.
None of this is a housing statistic. It is a mood reading. Today’s mood is cautious rather than panicked. Nothing here is investment advice.
The contradiction in the data
Europe’s housing numbers carry the same trap. One average hides a distribution. Start with the price series. EU house prices rose 69 percent from 2015 to the second quarter of 2026, Eurostat reports. In some member states, prices more than doubled. Rents and energy costs climbed as well.
The European Council’s framing is blunt:.” [1] Now the figure that looks like a refutation of the price series. The EU’s housing cost overburden rate averaged 7.7 percent in 2025. It counts people in households spending over 40 percent of disposable income on housing. Seven point seven. Roughly one in thirteen. Prices rose 69 percent and the stress rate stayed under eight.
Has nothing happened? Something has. The two figures differ in what they measure and in the period they cover. The price series runs to mid-2026. The overburden data are for 2025. One is an asset price. The other is a household cash-flow ratio. Both hold at the same time, and neither cancels the other.
The mechanism
Housing costs are monthly outlays. They include rent or mortgage interest. They include water, electricity, gas and heating. They include insurance, maintenance, repairs and taxes. Disposable income is income after taxes and social contributions. It includes benefits such as pensions.
The overburden rate is a ratio. Raise the numerator and it climbs. Raise the denominator and it falls. That is the transmission channel.
Prices outran incomes. The gap was widest at the bottom. Dr Hannah Widmer, ETH Zürich: “The main drivers of housing cost overburden are rising costs for housing (be it rents or house prices, which are spiking in many cities) in relation to the modest growth in incomes, especially for the lower quantiles of the income distribution” (quantiles are points that split a ranked income distribution into equal-sized groups). [1]
Interest rates reach the same statistic. Mortgage interest sits inside the definition. Energy does too. Utilities sit in the same bundle.
Dr Marietta Haffner of TU Delft sets out the arithmetic. When housing costs such as house prices, rents, energy prices, interest rates and inflation rise faster than income, the share of housing costs in income increases. Eventually, the share of those paying more than 40 percent of their income also increases.
The forward-looking warning concerns energy:.7 percent are not rivals. They answer different questions. A high price level and a low ratio can coexist. The reverse is possible too.
Who carries it
Greece tops the ranking. There, 26.4 percent lived above the 40 percent line in 2025. That is more than three times the EU average. Denmark follows at 14.7 percent. Germany: 11.2 percent. Sweden: 10.8 percent. Estonia 8.8, Czechia 8.2, Luxembourg 8.1.
The ranking spans 34 countries: the 27 EU member states, two EFTA countries and five EU candidate countries. Outside the EU, Switzerland records 15.3 percent. Norway records 13.5 percent. Three candidate countries sit above the EU average. Turkey 10, Montenegro 8.7, Serbia 7.9 percent.
At the other end, Cyprus 2.4 percent. Croatia 3.2, Slovenia 3.5, Slovakia 3.5. Among large economies, Spain 7.2 percent. France 6.4 percent, Italy 5.0 percent. Germany ranks fifth overall.
Shares are one thing; headcounts are another. More than 34 million EU residents live above the line. Germany accounts for 9.4 million of them. Turkey accounts for 8.6 million. France 4.4 million, Spain 3.5 million, Italy 2.9 million. Greece, far smaller, ranks sixth with 2.7 million.
Rate and count are different political problems. Rate shows how deep the stress runs. Count shows how many people feel it. The distribution inside countries is steeper still.
Across the EU, 29.1 percent of those at risk of poverty exceed the line. The group is defined by income below 60 percent of the national median. The EU median was 22,939 euros a year in 2025. That is 1,912 euros a month. Sixty percent of it: 1,147 euros.
For that group, Greece reaches 82.6 percent. More than four in five. Denmark 59.8, Switzerland 56.1. Sweden 46.8, Norway 43.8, Czechia 43.4. Germany sits at 35.0 percent against an EU average of 29.1. Spain 28.3, France 25.4, Italy 21.7. Cyprus is lowest at 7.6 percent. Albania 8.2, Croatia 14.9, Slovakia 15.4.
The comparison problem
The ranking invites a league table. The data resists one. Too much context differs for a scoreboard Rikke Skovgaard Nielsen, Aalborg University: “Given the very different contexts, not least in terms of economy and welfare system, the explanations for the level of the housing cost overburden in Greece, Switzerland and Denmark are not the same. And the consequences are not either” A practical point follows. The money people have left after paying rent, which is residual income, differs considerably between these countries, as do living costs. As a result, the impact on households varies too.
Tenure (whether a household owns, rents privately or rents socially) is the second dividing line:. Switzerland at 15.3 and Greece at 26.4 are not one phenomenon at two intensities. They are two phenomena sharing a statistical bucket.
What to watch, and what the data cannot do
Three things to watch. Energy first. Utilities sit inside the housing cost definition. A sustained energy move lifts the rate without a house changing hands. Interest second. Mortgage interest is inside the definition too.
The limits matter as much. The rate measures a share of income. It does not measure what is left afterwards. It says nothing about housing quality. A household at 41 percent looks identical to one at 39 percent. It cannot yet show the energy channel. That needs the next vintage (a particular release/edition of a statistical series).
That limit is not a defect waiting to be patched. It explains why 7.7 percent and 34 million are both correct.