
Four Years In: A Bull Market Priced Off the Long End
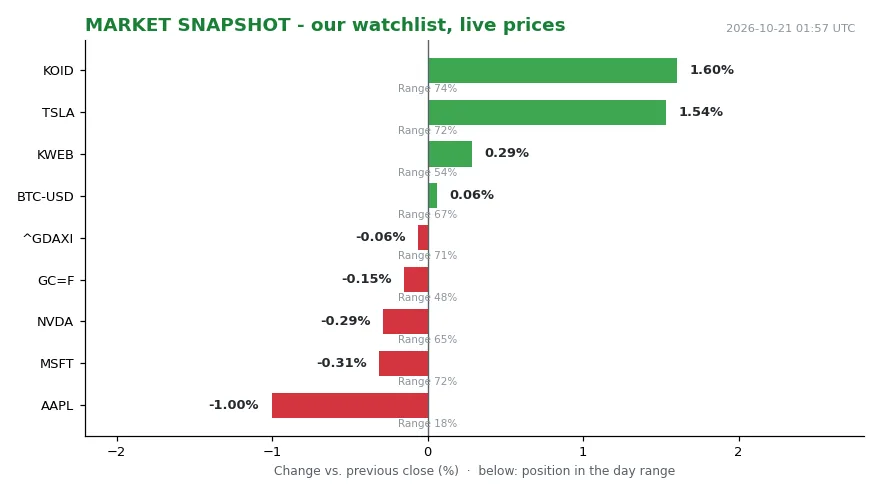
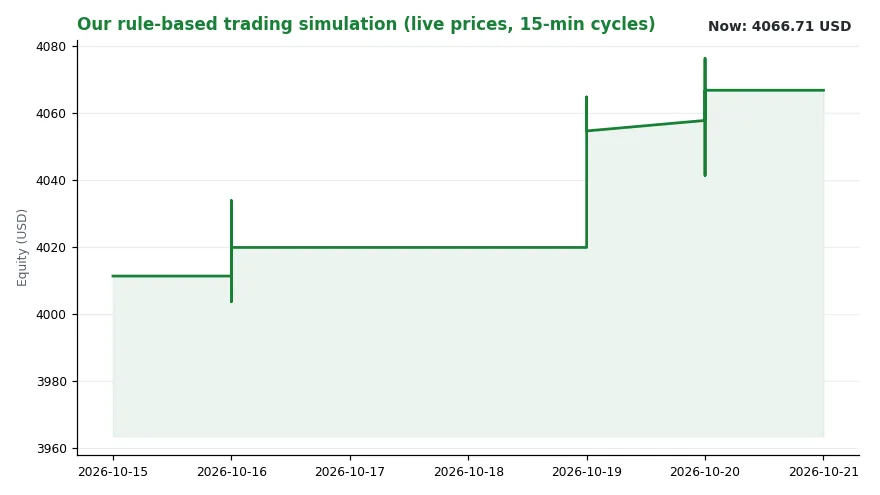
Our dashboard, read in a single pass: NVDA at 216.47 (-0.29% vs prev close, mid-range at 65%), AAPL at 339.50 (-1.00%, near day lows at 18% of range), MSFT at 531.87 (-0.31%, mid-range at 72%), TSLA at 373.71 (+1.54%, mid-range at 72%), BTC-USD at 83,087.24 (+0.18%, near day highs at 93% of range), GC=F at 4,137.00 (-0.14%, mid-range at 50%), ^GDAXI at 25,304.42 (-0.06%, mid-range at 71%), KOID at 33.58 (+1.60%, mid-range at 74%) and KWEB at 24.35 (+0.29%, mid-range at 54%). Our simulated book stands at 4,066.71 USD, flat versus the same time yesterday, with 2,036.50 in cash; the latest decision was WATCH KWEB. The busiest signal channel today is ‘central banks’ with three events, and the regime reading is trend falling at level 3.63. Around that measurement sits the wider tape: the S&P 500 (^GSPC) is up more than 15% over the last six months, the Nasdaq Composite (^IXIC) has gained nearly 20%, Brent crude futures trade near $106 a barrel and are more than 55% higher than at the start of the year, 10-year and 30-year Treasury yields have touched their highest levels since 2002, the S&P 500 Shiller CAPE (price divided by ten years of inflation-adjusted earnings, a long-run valuation gauge) sits just above 40 against a long-run average of 17 and a dot-com-era record of 44, the ten largest companies carry roughly 40% of the index’s total value, CME Group’s FedWatch probability (CME’s market-implied odds of a Fed rate move, derived from fed funds futures) stands at 88% for another rate hike before year-end, and the index is up more than 766% since early 2000 [1]. Four readings describe the pattern: the long end of the curve (the maturities of government bonds far in the future, whose yields move most on long-run growth and inflation expectations), the oil price, the valuation multiple, and concentration. The rest of this market is downstream of those four.
What the headline number hides
This month marks four years of the current bull run, and the index level alone would suggest a broad advance. It is not one. A market-cap-weighted index (an index where each company counts in proportion to its total market value) is a statement about the largest companies, not about the average company, and when the top ten names supply about 40% of total value, the index’s fate is a bet on a handful of balance sheets — several of them, including Nvidia, Amazon and Microsoft, with large exposures to AI capital spending [1]. That structure is what turns three separate macro headwinds into one correlated price.
The three headwinds themselves are ordinary. Long-term yields have risen to multi-decade highs, which makes borrowing more expensive from mortgages to credit cards, and more expensive debt tends to pull consumer spending down and growth with it. Oil has climbed all year on the war in Iran, keeping inflation above the Federal Reserve’s 2% target; the Fed raised rates in September and the market assigns high odds to another move. Higher rates then reach the companies spending hundreds of billions on data centres — and if the AI build-out slows because capital costs more, the index feels it disproportionately [1].
The micro-channel: how one stock moves another
Macro explains why the discount rate (the interest rate used to convert future cash flows into today’s value) changed. It does not explain how a shock in one name becomes a shock in the index. Research on correlated financial markets has examined the cross-response of individual stocks — the price change in one name following trades in another — and finds the effect transient rather than permanent, a result interpreted through the lens of market efficiency.
The finding that matters here is the cross-response: the price change of one stock following trades in another. It is transient rather than permanent — a result read through the lens of market efficiency, where a lasting impact from another company’s order flow would be hard to justify. Trade-sign cross-correlations (the statistical link between whether buys or sells dominate in two different stocks) across stock pairs turn out to be a short-memory process rather than a long-memory one — the link fades quickly with time rather than persisting.
That is the plumbing beneath index concentration. The top-ten weight is not ten independent bets sitting in one wrapper; it is a network in which impulses cross between names and then fade.
Who gains, who pays, who decides
Higher yields raise costs for anyone refinancing and impose price losses on existing holders of long-duration bonds. Expensive oil transfers income toward producers and away from fuel consumers, and it keeps the inflation measure the Fed watches above target. A higher discount rate compresses the present value of cash flows that arrive far in the future, which is the category most of the AI build-out belongs to. Passive index investors own the concentration whether or not they chose it.
The decisions sit elsewhere: the Fed on rates, and on the supply side whatever governs the oil price in the current conflict. Neither is forecastable from a valuation ratio, which is why the CAPE is a gauge of severity rather than of timing [1].
What to watch next
Four observable things: whether 10-year and 30-year yields hold at multi-decade highs; whether Brent stays near $106; whether the FedWatch probability of another hike stays elevated or decays; and whether the Shiller CAPE near 40 mean-reverts (drifts back toward its historical average) through price or through earnings. On timing, the honest answer is that no indicator in this set dates a turn — the CAPE has flagged the severity of past drawdowns (the fall from a peak to a subsequent low), not their arrival [1]. History is about horizons, not months: since 1919, the S&P 500 has ended each of its rolling 20-year periods (any 20-year window starting at each successive date) with positive total returns, according to analysis from Crestmont Research, and the index has survived the dot-com bust, the Great Recession, the COVID crash and the 2022 bear market [1].
Sources
Mentioned organisations (context, not sources)
- Amazon — Organisation (homepage)
- Apple — Organisation (homepage)
- Chevron — Organisation (homepage)
- CME Group — Organisation (homepage)
- Exxon Mobil — Organisation (homepage)
- JPMorgan — Organisation (homepage)
- Microsoft — Organisation (homepage)
- Nasdaq — Organisation (homepage)
- Nvidia — Organisation (homepage)
- U.S. Department of the Treasury — Organisation (homepage)