
UK Inflation Rises on Transport and Fuel Costs
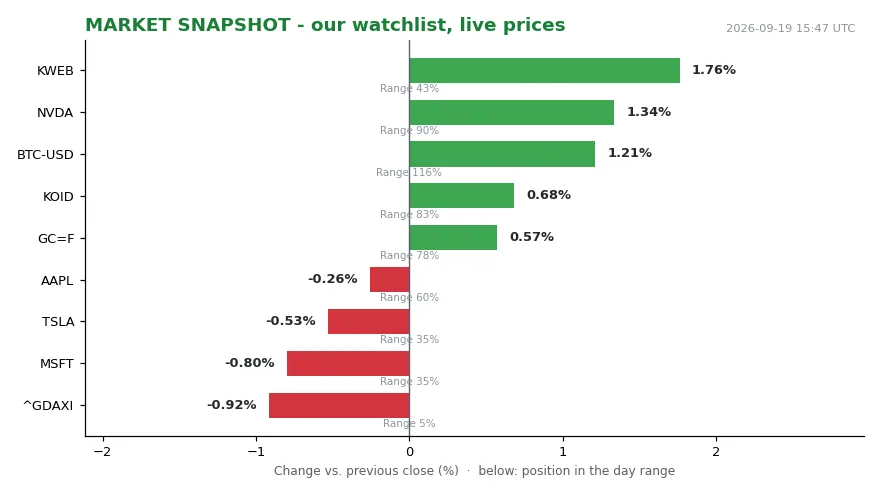
The market’s own tape, read before anything else: NVDA at 222.27, up 1.34% and parked at 90% of its daily range. Gold at 4424.90, up 0.57%, at 78% of range. Bitcoin at 81779.09, up 1.12%, trading above the upper edge of its own intraday band against the prior close. Meanwhile the DAX sits at 25304.06, down 0.92%, at 5% of its range — flat on the floor. That is not a market fleeing risk. It is a market rotating inside risk: out of European industrials, into precious metal, into crypto, and into the one AI name that keeps getting bought on any dip. A single day’s tape cannot prove a causal link, but the shape is legible.
That shape is the frame for today’s news. The UK’s inflation rate rose to 3.1% in the 12 months to August. [1] The Office for National Statistics says this is the highest reading since December 2025. [1] The largest single contributor was the transport sector, and inside transport, motor fuel — now at its highest level since 2022. [1] Forecasts circulating around the print suggest price growth could reach as high as 4% by the start of 2027. [3]
The gap between the pump and the spreadsheet is the real story here. The price board at the petrol station moves in weeks; the index that is supposed to describe it moves in months.
What we knew
Inflation had been falling moderately between March and June. The Bank of England watches CPI closely when it sets interest rates. The basket behind CPI is not fixed — it is revised once a year to reflect what households actually buy. The release mechanics are fixed too: the ONS publishes at 7am, once a month, alongside its other headline macro data such as GDP, labour market and wage figures.
What we did not know
Transport was not expected to take over as the engine. Energy and motor fuel were supposed to be the fading part of the story, the part already written off. Instead they pushed price growth up. This is not primarily a domestic wage story or a services story. It is an import-price story wearing a household budget’s clothes.
The mechanism
The channel runs in two steps. Higher fuel and energy costs enter the CPI basket directly, month by month. They also enter it indirectly, because haulage, delivery, air travel and heating all carry an energy line inside their cost base. The second effect is slower and stickier than the first.
The Bank of England then faces a choice it cannot make cleanly. If it raises rates to slow consumer spending, mortgage costs rise and debts become more expensive to repay. Households have less money to spend, and prices should cool. If inflation were too low, the Bank would cut rates instead, households would keep more disposable income, and demand would firm up. Right now the Bank is being pushed toward the first lever by a component it does not control: imported energy prices.
Expectations matter more than the print itself. A 3.1% reading is a statement about the past twelve months. A 4% forecast is a statement about belief. If wage-setters and price-setters start believing the second number, the first one becomes self-fulfilling.
Who wins, who loses, who decides
Winners include energy producers and fuel retailers, whose revenue rises with the price they charge. So do holders of index-linked gilts, whose coupons scale with the index, and anyone holding gold, trading at 4424.90 on our tape, up 0.57% and near the top of its range. Savers benefit too, if rates stay elevated.
Losers include mortgage holders facing the refinancing wall, renters who absorb the costs landlords pass through, commuters and hauliers buying fuel at 2022 prices, and retailers squeezed between input costs and customers who cannot pay more.
The decider is the Bank of England’s rate-setting committee. The scorekeeper is the ONS, which will keep publishing at 7am. The silent editor is the basket itself: whoever decides which goods belong in the index is deciding what “the cost of living” is allowed to mean.
What comes next
The next readings are dated. 21 October covers September. 18 November covers October. 16 December covers November. 20 January 2027 covers December. Each lands at 7am. The transport line is the current driver. Whether energy follows it or fades is unclear. Whether the 4% projection survives contact with the winter months is uncertain.
The tape offers one further clue. KWEB at 24.83 is up 1.76%, mid-range. KOID at 35.51 is up 0.68%, near its highs. NVDA, gold and crypto are bid; the DAX is offered. That looks like a market already treating inflation as a 2027 problem rather than a 2026 one, and rotating into assets that do not care much about a monthly index print.
A falling trend at an elevated level rarely resolves quietly.
What I still cannot answer
The basket is revised once a year, and always with a lag. Fuel at 2022 highs is counted in the August figure with full weight. Whether a household that has already cut its driving, or switched to a heat pump, or moved closer to work experiences that same weight is a separate question, and the index does not answer it. The 4% projection is a forecast, not a measurement, and forecasts built on an energy component have a poor record of arriving on schedule. The Bank’s lever works with a lag measured in quarters, against a price that repriced itself in weeks. The number is measurable. Whether it describes what households are actually living is a separate question.
Sources
1. Office for National Statistics (Organisation (Startseite))