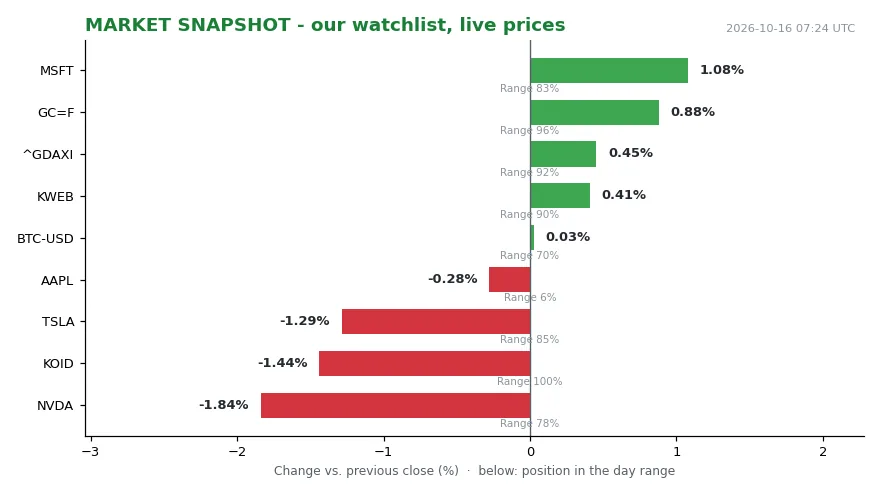
At 07:21 UTC on 16 October, our watchlist read like a weather map on a day when no two neighbourhoods agree. Nvidia (NVDA) printed 217.23 USD, down 1.84 % against the previous close, yet it still sat near the top of its daily range — 78 % of the way up. Microsoft (MSFT) traded at 539.44 USD, up 1.08 %, and also hugged its high, at 83 % of range. Gold (GC=F) stood at 4206.40 USD, up 0.87 % and pinned to 96 % of its range, effectively at the ceiling.
Read those three together and the pattern is rotation, not retreat. Tesla (TSLA) was down 1.29 % but still near the top of its range, at 85 %. Apple (AAPL) traded at 342.00 USD, down 0.28 %, and sat near the bottom, at 6 % of range. Bitcoin (BTC-USD) quoted at 82,178.06 USD, up 0.06 %, mid-range at 74 %. The German DAX (^GDAXI) sat at 25,493.17, up 0.44 %, again near its high at 83 %. KOID traded at 32.87, down 1.44 %, and closed the reading at 100 % of range. KWEB printed 24.61, up 0.41 %, at 90 % of range.
Nothing in that list says panic. Something in it does say unease: a classic defensive asset at its high, a megacap at its high, and a handful of names at their lows, all within the same hour.
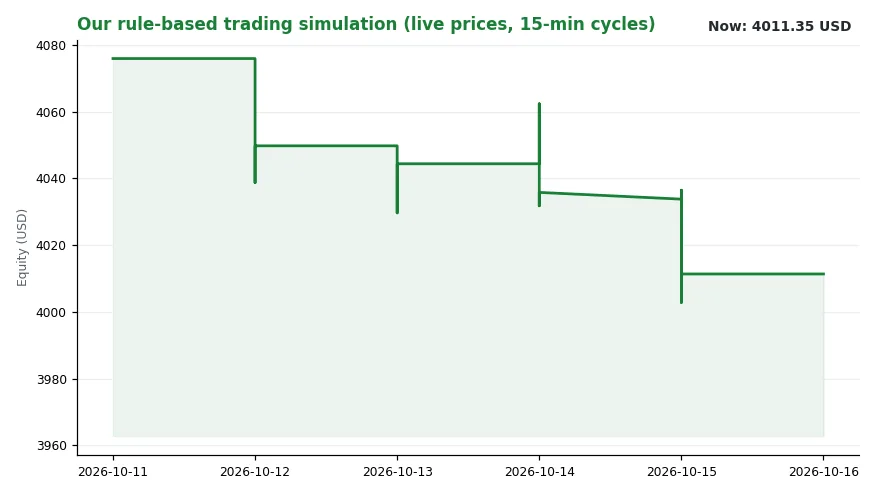
Our own book reflects the same flatness. The simulated equity stands at 4,011.35 USD, which is +0.00 % versus the same time yesterday. Cash is 2,014.07 USD. The latest rule-based decision was WATCH KWEB @ 0.00, logged at 09:13:22 on 16 October. The busiest channel in our signal layer on 16 October was “central banks”, with 2 events. Our regime reading says trend=falling, level=3.63.
That is the weather we can actually measure: a downtrend that has not yet become a storm.
What the poll found
Into that ambiguous sky comes a hard number about perception. Nearly two-thirds of Americans think the US is experiencing a recession, according to a new Harris Poll conducted for the Guardian. [1] That is the finding, and it is the reason the Guardian is now asking readers a follow-up question.
By the typical definition of a recession — growth in negative territory for two consecutive quarters — the US is not in one. The gap between those two facts is the story. A country can be, on paper, expanding and still feel to most of its residents like it is contracting.
The explanation sits in two data points the Guardian cites. Americans are facing higher prices, per the September inflation numbers published on 14 October. [1] They are also facing a stagnant job market, per the September jobs report published on 2 October. [1] So the Guardian has opened a callout to readers. It asks: do you feel like the US is experiencing a recession? And what is your personal “recession indicator” — the signal in ordinary life that points to an incoming slump? The paper suggests the answer might live at your job, at your local grocery store, at your children’s school, or out in your community.
How a felt recession reaches the wallet
The transmission from statistic to sensation runs through a few well-worn pipes, and the order matters. Prices rise first, because a grocery bill is a daily measurement and a growth figure is a quarterly one. Real incomes then compress, since wages reprice more slowly than the shelf.
Households respond by trimming the discretionary layer of spending. Employers, watching that trim, slow their hiring before they cut their headcount. A stagnant job market is exactly this state: fewer doors opening, not many closing. It raises the cost of switching jobs, which is where most pay gains come from.
Central banks sit on the other side of the pipe. They watch inflation, weigh it against employment, and set the price of money accordingly. Rate expectations feed straight into mortgage offers, car loans, and business credit lines.
Asset prices carry the last leg of the journey. Equities near their highs flatter those who own them and tell everyone else nothing about their own week. Gold near its highs tells a different story — one about hedging, not exuberance. Both were true in our reading at 07:21 UTC.
One number does not settle anything. It describes direction, not destiny, and we treat it as a reading rather than a verdict.
Who wins, who loses, who decides
The winners in this configuration are narrow and identifiable. Owners of the megacaps that keep printing near their range highs. Holders of gold, which sat at 96 % of range. Anyone who locked a fixed rate before the price of money moved.
The losers are equally identifiable, and they are more numerous. Renters renewing a lease. First-time buyers doing the arithmetic on a mortgage. Job seekers, who pay for a stagnant market in months rather than percentage points. Shoppers absorbing higher prices with a flat wage.
Then there are the deciders. Central banks choose the cost of money, and their gatherings dominate our event log. Employers choose whether to post a vacancy at all — a decision that rarely makes headlines and changes lives anyway. Retailers choose how much of a price increase to pass through and how much to swallow.
We are not issuing calls on any of it. Our WATCH KWEB entry is a log of our own rule set, not guidance for anyone else. What follows is education, not advice.
What we watch next
The next inflation print is the first thing on the board. It decides whether the stagnant-job narrative gets confirmed or disrupted. The next jobs report is the second, because a stagnant labour market either loosens or it does not.
Central bank communication is the third, and it is the busiest channel we track. Every signal about the path of rates is a signal about the monthly cost of living for someone with a variable-rate loan. We will keep counting events there.
We will also keep watching the internal tension in the tape. KOID at 100 % of range and Apple at 6 % are two ends of the same session, and they cannot both describe the same economy forever. We will keep logging the rotation until it resolves into a direction we can name.
We will also keep reading the poll results, because perception is a data series too — and the personal “recession indicator” is the more interesting half of the question.