
What our screens showed before the headline
There is a moment, just before a market decides, when the tape goes quiet and every participant stares at the same number. For bitcoin this week, that number is 80,000 dollars.
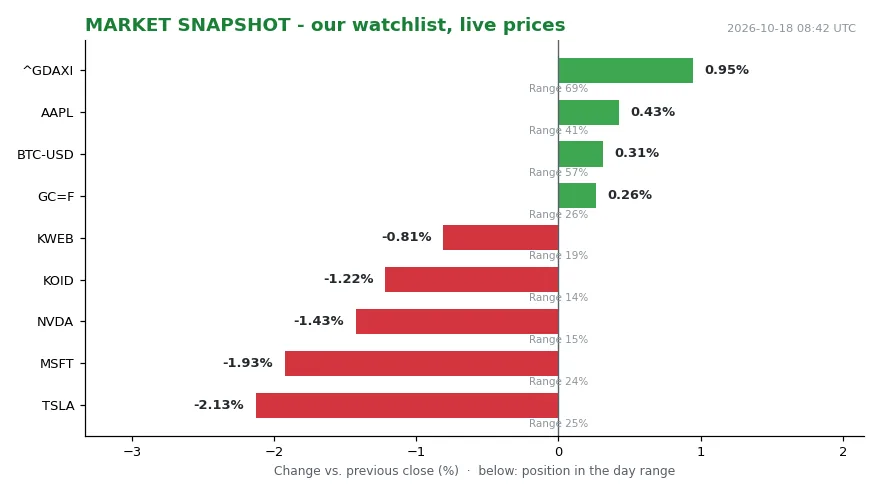
Our own desk measurements, taken at the last pre-publication snapshot, put bitcoin at $81,638.13 — 0.31 percent above the previous close and mid-range, at the 57th percentile of its daily range. That first reading, on its own, says almost nothing; a price is not a signal. The second reading is where the picture starts to form: spot sits mid-range, at the 57th percentile of the day’s range, meaning the market has spent the session on both sides of where it trades now. The third reading completes the shape. Our signal layer’s busiest channel today is central banks, with four events, while the regime reading shows trend falling at a level of 3.63.
Read together, those three numbers describe something we have seen before — not a collapse, but a handover. Leverage is being paid down rather than added. Spot is doing the work. And the coins that move in whale-sized clips are moving toward venues more than away from them.
That is our measurement, and it describes a market holding above a round number rather than breaking one.
What the market snapshot shows
That is a snapshot of a market testing a level, not a verdict on a cycle: bitcoin has traded above $81,500 while retreating from a recovery attempt toward $87,333, and it briefly fell below $80,000 earlier in the week before recovering.
The mechanism: why round numbers bite
The channel through which a level like $80,000 operates is mechanical before it is narrative. Round numbers in any market attract a density of resting orders — stop-losses, take-profits, and option strikes cluster there because humans choose round numbers when they choose prices. When price approaches such a cluster, market makers who are short gamma must hedge in the direction of the move, which amplifies that move. That is not a theory about bitcoin specifically. It is the ordinary plumbing of a derivatives market, and it explains why struggling above is a describable state rather than a vague mood.
The second channel is the cost of leverage. When funding sits near flat or slightly negative, holding a long position is no longer paying a meaningful carry, and the incentive to add exposure weakens. Deleveraging of that kind does not produce dramatic headlines. It produces exactly the sort of grind our screens recorded: price pinned near a visible level, range position deteriorating, volatility compressing rather than exploding.
The third channel is supply. Whale activity matters because large transfers change the visible order book. Coins moving to exchanges expand the potential sell-side; coins moving to self-custody shrink it. The source data is genuinely mixed here: CoinGlass showed positive spot exchange netflows of $18.65 million, while Whale Alert logged 888 BTC withdrawn from Kraken, and holders who acquired coins six to twelve months ago cut the share of their transfers directed to exchanges from 40.4% in June to 4.4% by October 15 even as their 30-day transfer volume rose to 205,400 BTC from 157,700 BTC.
Who wins, who loses, who decides
The actors here are not hard to identify, and their interests diverge sharply.
Leveraged longs are the most exposed cohort. With funding flat and price sitting in the lower part of its range, waiting carries no funding cost, though opportunity cost and liquidation risk remain. They lose in slow motion, which is why they rarely appear in headlines.
Spot accumulators are the counterparty. For an allocator with a multi-year horizon, a market that stops falling but cannot rise widens the set of price points at which a long-horizon allocator could transact, and the absence of funding costs removes the cost that usually penalizes waiting.
Miners sit in between. Their economics are set by price and by network difficulty, and a prolonged stay near a round number compresses margins without forcing immediate decisions.
Market makers and venues are structurally indifferent to the direction and structurally dependent on the level. Volatility around a visible threshold is their inventory; a market that simply drifts is not.
And the deciding actor is the least dramatic one: the marginal spot buyer. Whales can move the book, but they cannot set a price that no one else is willing to transact at. That is why the level keeps being tested rather than resolved.
What we watch next — and what we do not know
Four things will tell us whether this is consolidation or distribution.
First, the weekly close relative to $80,000. A close above the level after a week of struggle is a different data point from a close below it, and the difference is measured in basis points, not narratives.
Second, funding normalization. If perpetual funding returns to positive territory while price holds, leverage is returning and the structure is fragile. If funding stays flat while spot volume grows, the handover described above is real.
Third, whale transfer destinations. Venue inflows sustained over several weeks would confirm the sell-side interpretation; a return to self-custody would undercut it.
Fourth, realized volatility. Compression near a threshold is usually resolved by expansion, but the direction of that expansion is not predictable from the compression itself.
What we genuinely do not know is whether $80,000 is a floor being defended or merely the next stop on the way lower. Anyone who states the answer with confidence is describing their position, not the market.
On thresholds
A price level is a strange kind of object. It does not exist in the asset, which has no memory of where it has been. It exists in the participants — in the stop orders they placed months ago, in the strike prices they chose because the number was round, in the shared assumption that other people are watching the same line. An $80,000 bitcoin is not physically different from a $79,900 bitcoin. What differs is the density of human intention gathered at that coordinate.
Markets spend most of their time not deciding, and the honest description of a market that has not decided is a description of pressure, not of outcome.
The number holds, or it does not. Everything else is commentary.
This article is educational analysis, not investment advice. It contains no buy or sell recommendation. All prices cited are desk snapshot readings taken before publication and will be stale by publication.