Ten Year Treasury Yield Tops Five Percent In Bond Selloff
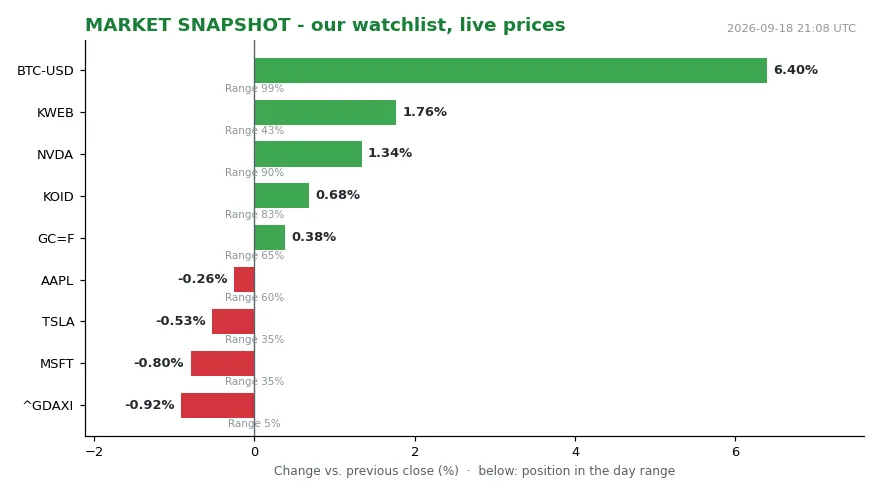
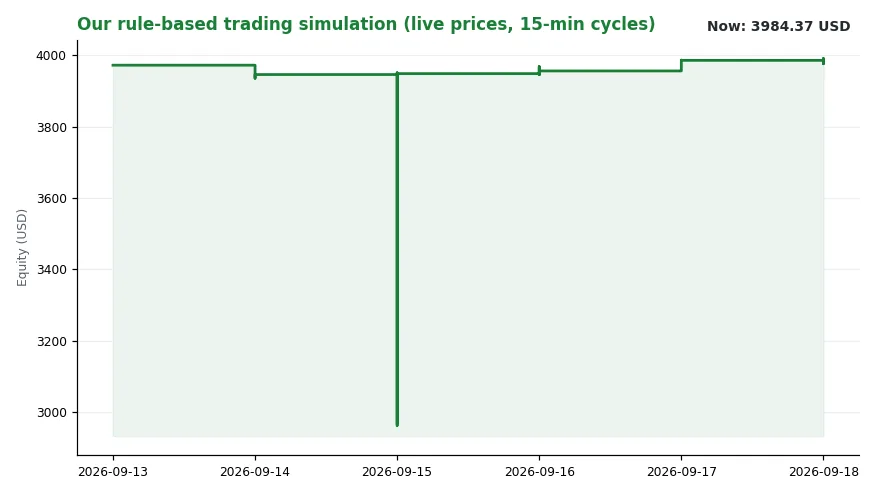
The 10-year Treasury note briefly yielded more than 5 percent this week, its highest level in 19 years, before pulling back to 4.946 percent on Thursday. NVDA traded at 222.27, up 1.34 percent and sitting at 90 percent of its daily range — near the top. BTC-USD stood at 81,096.21, up 6.22 percent and at 96 percent of its range, the strongest position on the board. ^GDAXI fell 0.92 percent to 25,304.06 and closed near its session low, just 5 percent above the bottom of the range. MSFT slipped 0.80 percent and TSLA lost 0.53 percent, both mid-range. AAPL eased 0.26 percent. GC=F held at 4,414.80, up 0.34 percent, also mid-range. KWEB rose 1.76 percent, KOID added 0.68 percent. Our regime classifier read Trend=fallend — falling — at a level of 3.63. The busiest channel in our signal layer on September 17 was “zentralbank” with three events. Our simulated equity book stood at 3,984.37 USD, down 0.03 percent from the same time a day earlier. Cash inside that book was 1,987.26. The last logged decision was BEOBACHTUNG KWEB at 0.00, because the market was closed and observing was the only honest action.
That is the frame for the move in the 10-year Treasury note.
The 10-year Treasury note is the benchmark against which virtually every other price in the world is measured. It began the year on a very different footing. When the Iran war started in late February, the yield stood at 4 percent. Half a decade ago it was around 1.3 percent. For the note itself, the past five years have been a long, slow loss of standing.
The bond market’s broad benchmark also declined. The Bloomberg Aggregate Bond Index — the bond world’s answer to the S&P 500 — was down 1.6 percent on a total-return basis this year through Wednesday’s close, according to Dow Jones Market Data. [7] That index bundles Treasurys, corporate bonds, mortgage-backed securities and other government-backed debt. It deliberately excludes ultrashort Treasury bills. Earlier in the year its return flipped between positive and negative. In August it turned consistently more negative as global crude-oil prices climbed toward $100 a barrel.
The mechanism is not mysterious. Oil is an input cost, and when it rises, inflation follows. Inflation damages bonds, and it damages long-dated ones most of all. A fixed coupon buys less when the cost of living climbs. The Federal Reserve, under new Chairman Kevin Warsh, raised interest rates this week for the first time in three years. [1] Warsh said the economy can absorb the removal of a “dose” of accommodation. [1] “The Fed and the market lost patience with how long inflation has been above target,” said George Catrambone, Americas head of fixed income at DWS. [2] He also pointed to the Iran war, which has dragged on longer than many expected.
The trade-off is straightforward. A rate hike will not push more oil out of the Persian Gulf. It cannot end a war. What it can do is change the arithmetic for anyone holding a bond. The start of a second hiking cycle since 2020 has calmed the selloff at the long end of the curve. The 10-year yield fell 5.7 basis points on Thursday to 4.946 percent, its lowest reading in a week, according to Dow Jones Market Data. [7]
Warsh was asked about the Treasury rout on Wednesday. He pointed to global “hot spots” and to several other factors pressing on what he called “the most important asset anywhere in the world.” “It’s the risk-free asset upon which every price of virtually every asset in the world is related to,” he said. A yield move matters far beyond fixed income.
Investors are noticing. “The higher that yields go — for at least new money — it becomes more enticing to think about putting money into bonds,” said Brian Rehling, co-head of global fixed-income strategy at the Wells Fargo Investment Institute. The flows confirm it. U.S. bond funds have recorded 71 straight weeks of inflows, according to Winston Chua, a liquidity analyst at EPFR. [3] The money has concentrated at the short end. U.S. short-term bond funds grew to 12.2 percent of assets, or $139.9 billion, over that stretch. [3] U.S. long-term bond funds took in just 2.9 percent of assets, or $19.3 billion. [3] This happened even though short-term debt delivered flat performance. The net asset value of U.S. long-term bond funds fell close to 5 percent, Chua said.
The arithmetic of the last half decade is brutal, and Goldman Sachs put a number on it Thursday. A strategy team led by Christian Mueller-Glissmann charted five-year rolling returns on the 10-year Treasury note. [4] It was the worst such period in more than a century, before adjusting for inflation. [4] “In real terms, they were nearly as bad as after World War I and World War II and in the 1970s,” the team wrote. [4] The red ink shows how painful inflation can be for a saver. Stocks have run a bull market of nearly four years that lifted many households. Bonds received no such help.
This is also a story about policy that keeps rates ultralow for too long. Borrowing conditions were easy for much of the past half decade. The low starting point of half a decade ago explains much of the damage now showing up in rolling returns. Cullen Roche, founder and CIO of Discipline Fund, an investment adviser and ETF manager, was not surprised by the five-year record. [5] He said bonds delivered weak returns because yields were low on average and interest-rate risk was exaggerated five years ago. [5] Yet he added that as yields rise and prices fall, the asset becomes more attractive. He compared it to buying a cheaper used car and driving it until it dies. Old bonds and old cars both lose value more slowly with time. The difference is that a bond keeps paying the same income each year, whatever its market price.
So where is the balance? Higher starting yields on new bonds mean more income and more downside protection. That is the gain. The losses are real too: inflation risk remains, and the path of the Iran war is unknown. The Fed indicated on Wednesday that inflation could finish the year near 3.7 percent. [1] It expects to reach its 2 percent target only in 2029. “It’s still safe to say that there’s risk in long-term bonds, but they’ve become more attractive, and short-term bonds have become very attractive,” Roche said. [5] That is a trade-off, not a verdict.
Buyers of new paper collect higher coupons than they could a year ago. Holders of older low-coupon bonds watch market value fall as yields climb. Long-duration fund investors have already felt this, with net asset values down nearly 5 percent. The decision-makers are the Fed and its new chairman. They set the pace of the hiking cycle. Oil producers, war logistics and global supply routes sit outside their control. That gap between the lever and the problem is the honest core of this story.
The next signals to watch are concrete. The 10-year yield sits near the 5 percent line. The Fed may follow one hike with another, as it did in the cycle that began in 2020. Oil has been the trigger for the worst stretch this summer. The flow data, with 71 weeks of inflows, show that patience has not broken. The distance between what the Fed says about inflation and what the war does to energy prices remains the key gap.
Crypto and gold finished near their highs while European equities closed near their lows. If the risk-free anchor is repricing, nothing priced against it stays still. The 10-year Treasury was the quiet constant beneath every portfolio for decades, and this decade it stopped being quiet. Investors are answering with their flows, moving to the short end and waiting?
Sources
2. DWS
3. EPFR
6. Bloomberg
7. Dow Jones