
Sovereign Yields Pull Marginal Dollar Away From Stocks
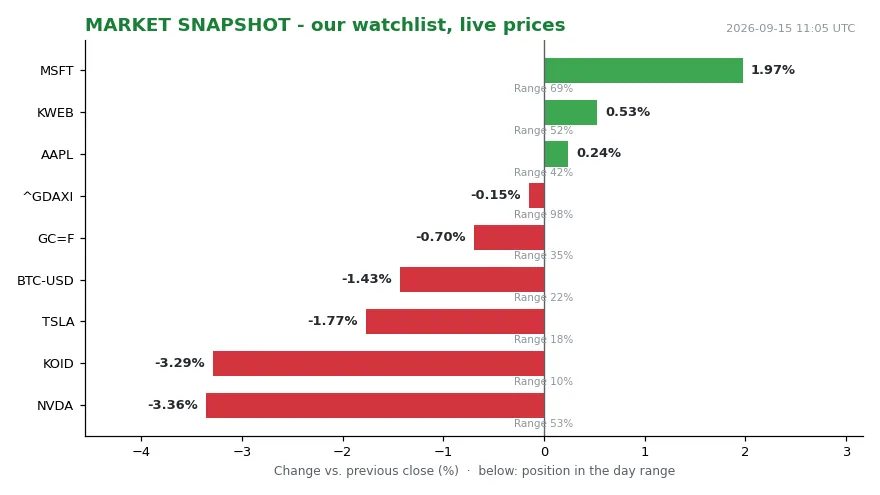
At 11:01 UTC on September 15, 2026, a fresh quote sheet lands on my desk, and the pattern is legible before anyone says a word. Nvidia prints 210.96, down 3.36 percent against the previous close, and sits only in the middle of its daily range. [1] Tesla trades at 358.97, off 1.77 percent, parked near the day’s lows at just 18 percent of its range. [2] The KOID line, my proxy for the AI and robotics complex, reads 34.71, down 3.29 percent and hugging the bottom at 10 percent of range. Bitcoin is quoted at 77,008.42, down 1.50 percent, again close to its session low. Then there is Microsoft at 505.41, up 1.97 percent, comfortably mid-range at 69 percent. [3] The German DAX sits at 25,407.67, barely changed at minus 0.13 percent, yet near day highs at 100 percent of its range.
That mix is the whole point. This is not a broad liquidation; it is a rotation with a direction. High-beta, long-duration, story-heavy assets are being sold into weakness. Cash-generative quality and European large caps are being held, or bought.
The survey data sits next to that tape. Bank of America’s latest fund manager survey, published on Tuesday, shows the share of global managers overweight stocks — bullish, in plain language — falling to 49% this month from 56% a month earlier. [4] Cash levels moved the other way, rising to 3.9% from 3.5%, the biggest monthly increase since March. [4] My prices and their survey describe one cautious mood. The headline is that surging US Treasury yields have started to spook stock investors. The mechanism behind that is not mysterious, and it deserves to be spelled out slowly. The 10-year US Treasury yield advanced slightly to 5.02%, eclipsing a peak from 2023 and marking the highest level since 2007. [5].
Portfolio Wealth Advisors president and CIO Lee Munson framed it plainly on Yahoo Finance’s Opening Bid. [6] “When you start getting close to 5% on a ten-year yield, it starts making that next marginal dollar more interesting in long duration sovereigns than it does trying to figure out what next quarter Micron’s earnings are going to be,” he said. [6] That is the channel. The quote focuses on the marginal dollar.
The contest has three visible inputs: inflation that refuses to cool, crude oil that stays elevated, and a US midterm vote whose outcome is unknown. Persistent inflation signs and elevated crude oil prices have reinforced expectations of higher interest rates from the Federal Reserve. Midterm election uncertainty in the United States adds a second layer on top. And managers have named the consequence directly: a “disorderly bond selloff” is now the top market tail risk in the survey. [4]
The sequence is straightforward. September opened with inflation data that refused to cool. Crude oil stayed elevated, reinforcing expectations of higher interest rates. Those two inputs fed into rate expectations. Rate expectations fed into the bond market. The bond market did not sell off in an orderly queue, and the equity market, reading the same signal, trimmed its exposure. The positioning numbers in the survey are the receipt for that trimming, not the cause of it.
The actors matter as much as the mechanics. Fund managers are the marginal sellers here, and their allocation is precisely what the survey measures. Holders of long-duration sovereigns are the paper beneficiaries of the same move. Owners of long-duration equities — growth names, AI-adjacent names, high-multiple names — are the ones absorbing the repricing. The Federal Reserve decides the path of policy, and therefore the anchor of the curve. Voters decide the midterm outcome, and therefore the fiscal and regulatory backdrop that follows. Neither group answers to a survey.
Managers remain bullish on corporate earnings, on the AI investment cycle and on economic growth. The retreat is therefore a positioning adjustment, not a rejection of the fundamental thesis. That distinction matters, because it separates de-risking from disbelief.
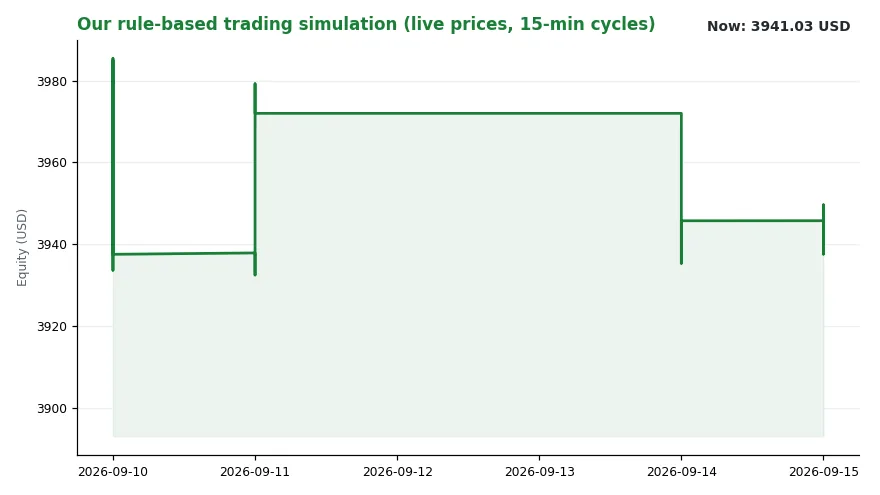
My own rulebook account reflects the same caution. The simulated equity stands at 3,941.03 USD, down 0.12 percent from this time yesterday, with 2,010.97 in cash. The last logged decision was BEOBACHTUNG KWEB at 0.00, timestamped 2026-09-15 13:01:09, after the quote sheet timestamp, with the stated reason that the market was closed — observe only, do not trade. My regime classifier reads trend as falling. The most active signal channel on September 14 was “sonst”, with two events. Sometimes the most informative reading is that the instruments are quiet while the tape is not.
Three developments carry the next stretch. First, whether the 10-year yield holds above 5% or slips back below it, because that line has become the market’s psychological reference. Second, the next monthly reading of the BofA survey, which will indicate whether 49% was a pause or the beginning of a longer de-risking. Third, oil and the inflation prints that feed the Fed’s expectations.
And then there is the calendar, which does not negotiate. The US midterm elections fall on November 3, 2026, and that date is the hard edge of the current uncertainty. [8]. Between now and then, the yield question, the survey question and the inflation question all have to resolve or at least grow quieter. No forecast is implied about which way any of them break. The marginal dollar now has somewhere else to go — and that, not the size of any single day’s move, is the pattern worth watching.
Sources
1. Nvidia
2. Tesla
3. Microsoft
5. US Treasury
7. Micron