Market Rotation Not Panic As AI Inflation Risks Build
Our numbers lead.
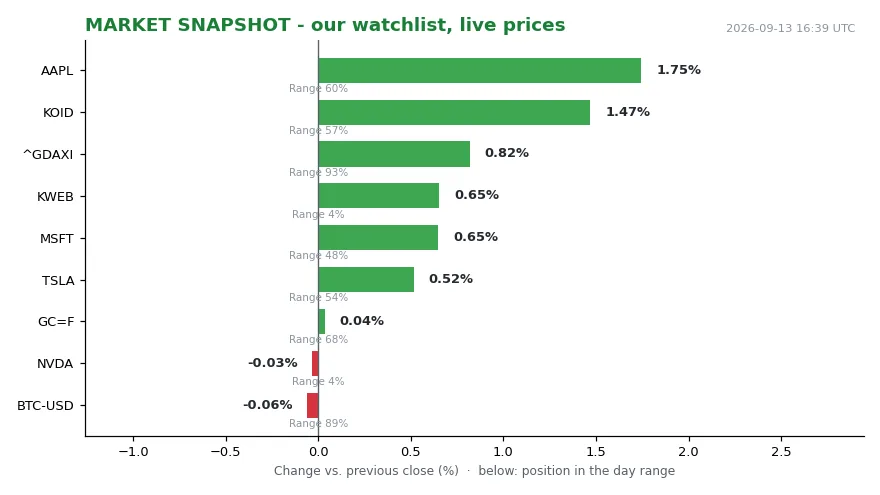
Our watchlist snapshot, stamped 2026-09-13 16:35 UTC, shows NVDA at 218.29. That is down 0.03%, pinning the stock near its day’s lows — just 4% of its range. Apple printed 332.27, up 1.75%, sitting mid-range at 60%. [1] Microsoft added 0.65% at 495.63, roughly halfway through its range at 48%. Bitcoin traded at 77,227.38, flat at -0.06%, but near the day’s highs at 90% of range. Gold at 4,408.90 was quiet, plus 0.04%, mid-range at 68%. And the KWEB China internet ETF (exchange-traded fund, a basket of securities that trades like a stock) sat at 24.60, up 0.65%, yet near day lows — 4% of range.
Taken together, the pattern is not panic. It is rotation — money moving out of one market segment into another. The mega-cap AI complex is soft at the edges. Consumer hardware is firm. Crypto is holding its highs. Europe is leading, with the DAX at 25,568.56, up 0.82% and near the top of its range at 93%. KWEB drifts at the bottom of its range despite a green print.
Now the mistake.
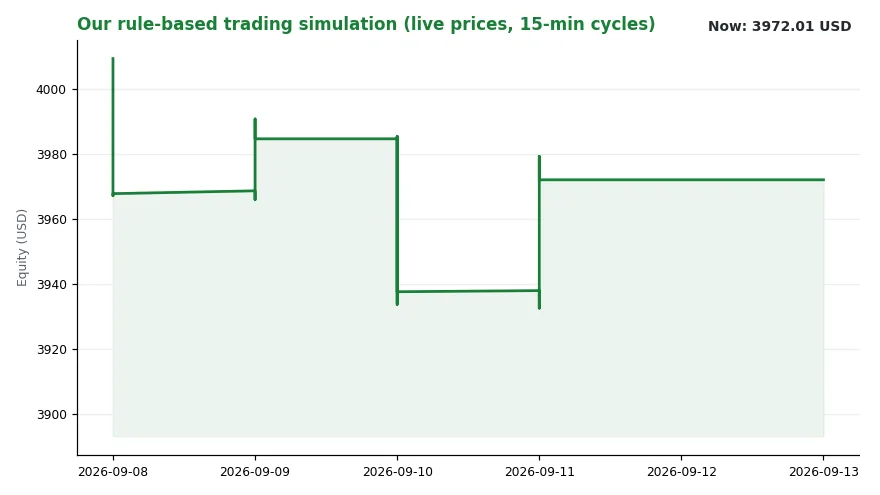
We thought our feed was broken. Our Sim-Equity stood at 3972.01 USD, +0.00% since the same time yesterday. Cash: 1991.34. A perfectly flat line usually means a dead socket. It was not dead. It was the honest output of a written rulebook, and the rulebook had said no.
The last logged decision was a BEOBACHTUNG — an observation — on KWEB. The system flagged a buy signal, because the ETF traded at 4% of its range, below the 35% threshold. But the seasonal cash rule requires at least 25% of assets in cash, 993 dollars here. The rule won. No forced trade, no position, no drama.
That non-decision is the whole argument in miniature. A signal fired, a constraint held, nothing happened. The flat equity line was not a broken instrument. It was the sound of a system refusing to mistake a cheap ticker for a reason to act. That misread turns out to be useful, because the question on the table is the same one.
On Aug 1, 2026, MarketWatch put it to three strategists and portfolio managers. The question: is the worst over for the stock market, or is the selloff just getting started? Wall Street had just limped through its roughest stretch in months. The Nasdaq Composite slumped 3.2 % in July. That was its worst month since March. The S&P 500 was off 0.1 %. The Dow Jones Industrial Average managed a modest 0.3% monthly gain, according to FactSet data. [2]
So the index level hid the damage. A flat S&P and a rising Dow cover a 3.2 % hole in technology names. Our own dashboard, six weeks later, still shows the same split. NVDA near its lows, AAPL and MSFT mid-range, the DAX near its highs. The wound stayed local.
Why does it move markets? Because the money that funded the rally is being asked to justify itself.
Investors grew anxious over the staggering cost of the artificial-intelligence buildout. The open question is whether hyperscalers (the handful of giant cloud/AI data-center operators) will ever earn a return on that eye-watering capital spending. That is a cash-flow question, not a mood. It has a mechanism.
Here is the channel. AI infrastructure consumes memory chips, among other inputs. Brian Kersmanc, portfolio manager at GQG Partners, points out that rising prices for those inputs raise costs. [3] Companies may eventually pass those costs to customers. That is inflation arriving through the capex (capital expenditure) door rather than the oil door.
Energy is the second channel, and it is louder. Oil prices swung wildly as escalating U.S.-Iran military strikes raised fears the conflict could spread across the Middle East. A renewed rise in oil in July threatened to reverse some of the cooling seen in June’s consumer-price index and personal-consumption expenditures reports.
The third channel sets the discount rate for everything else. The Federal Reserve held interest rates steady, and that offered little relief. [4] Longer-duration (more sensitive to interest-rate changes) Treasury yields — the long end of the yield curve, the 10-year and the 30-year — climbed sharply. Investors bet on more aggressive monetary tightening later in the year.
Kersmanc adds a feedback loop worth naming. “Inflation is as much a sentiment-driven thing as anything else,” he told MarketWatch. [3] If people believe prices will rise, they consume as though prices will rise. The longer inflation persists, the more it drives itself forward.
Callie Cox, chief market strategist at Ritholtz Wealth Management, draws the boundary. [5] She expects more swings, with inflation back as the driving force of the broader market. [5] “Understanding that inflation right now is the biggest risk to stock portfolios,” she said. [5] Growth, in her reading, does not look resilient heading into the end of the year.
Who wins and who loses in this setup? Memory and input suppliers win on price while the buildout lasts. Hyperscalers carry the capital burden and the return question. Bondholders win on yield and lose on duration. Equity holders in long-duration tech names pay the most, because their value sits far in the future. The Fed decides, and everyone else reacts.
What the strategists did not do is notable. None of them called for a further drawdown (a peak-to-trough decline in a market or portfolio) outright. They agreed on the ingredients, not the outcome. That gap between ingredients and outcomes is where honesty lives.
Our own regime (the current market environment/state as classified by the model) read says Trend=fallend, level 3.63. The most active signal channel on 2026-09-07 was “zentralbank” (German for “central bank”), with two events. A falling trend, a central-bank channel and a cash rule that keeps us out of cheap-looking names — that is a cautious configuration, not a forecast.
What to watch next is unglamorous. The next CPI (consumer-price index) and PCE (personal-consumption-expenditures price index) prints. Oil, and whether the Middle East risk premium (extra return investors demand for holding a riskier asset) decays. The 10-year and 30-year yields, which price the Fed’s next move before the Fed makes it. Memory chip prices, which carry the AI inflation story in a single line item. And hyperscaler capex commentary, where the return question will be answered or dodged.
The instrument is the dashboard. The syndicated version we can read names two strategists. A third strategist is behind a link. No third strategist is invented.
Here is the historical echo, and it is a strange one. The natural comparison is 2022, when inflation ran hot and portfolios bled. Cox explicitly rejects that comparison. The 2022 crisis was fueled by pandemic-related supply-chain disruptions and massive fiscal stimulus. Today’s drivers are different in kind, she argues, and should not trigger a repeat.
So the mirror shows us the episode that does not fit. What it predicts is narrow. The next drawdown, if it arrives, will not be a rerun of the last one. It would come through capex, input prices and the long end of the yield curve. That is what our flat equity line was trying to say. Nothing was broken. The rules simply held.
Nothing here is investment advice. It is a record of what we measured, and what we chose not to do with it.
Sources
1. Apple
2. FactSet
3. GQG Partners